Much have been said about the importance of optimizing services that are going to run in a cloud, and they are plenty of resources about the topic, from start up times, memory consumption or resource usage and dozen of data points of your applications.
But even with this amount of information it get exponentially complex to understand why we are doing this?, and what actually means?. So I decided that is going to be simpler to just learn by example, so this is the first part of a series of articles that will help on this matter.
We are going to create a series of services that we will deploy in our kubernetes (k8s) cluster, and we will learn how we could measure them. Them we will optimizing our service to perform better, so we could measure if what we have done improves using data we could use to understand why.
In this first part on the series we will create our base service that will be use as a baseline for comparing the improvements that will be doing down the line, for this our service will be developed with default values, including configuration, forgetting things that we usually do for optimizing an application in order to understand what those optimizations actually do.
We will use the Microk8s cluster that we recently setup and the movies database that have been loaded with the previous k8s job.
Bootstrapping a Spring Boot application
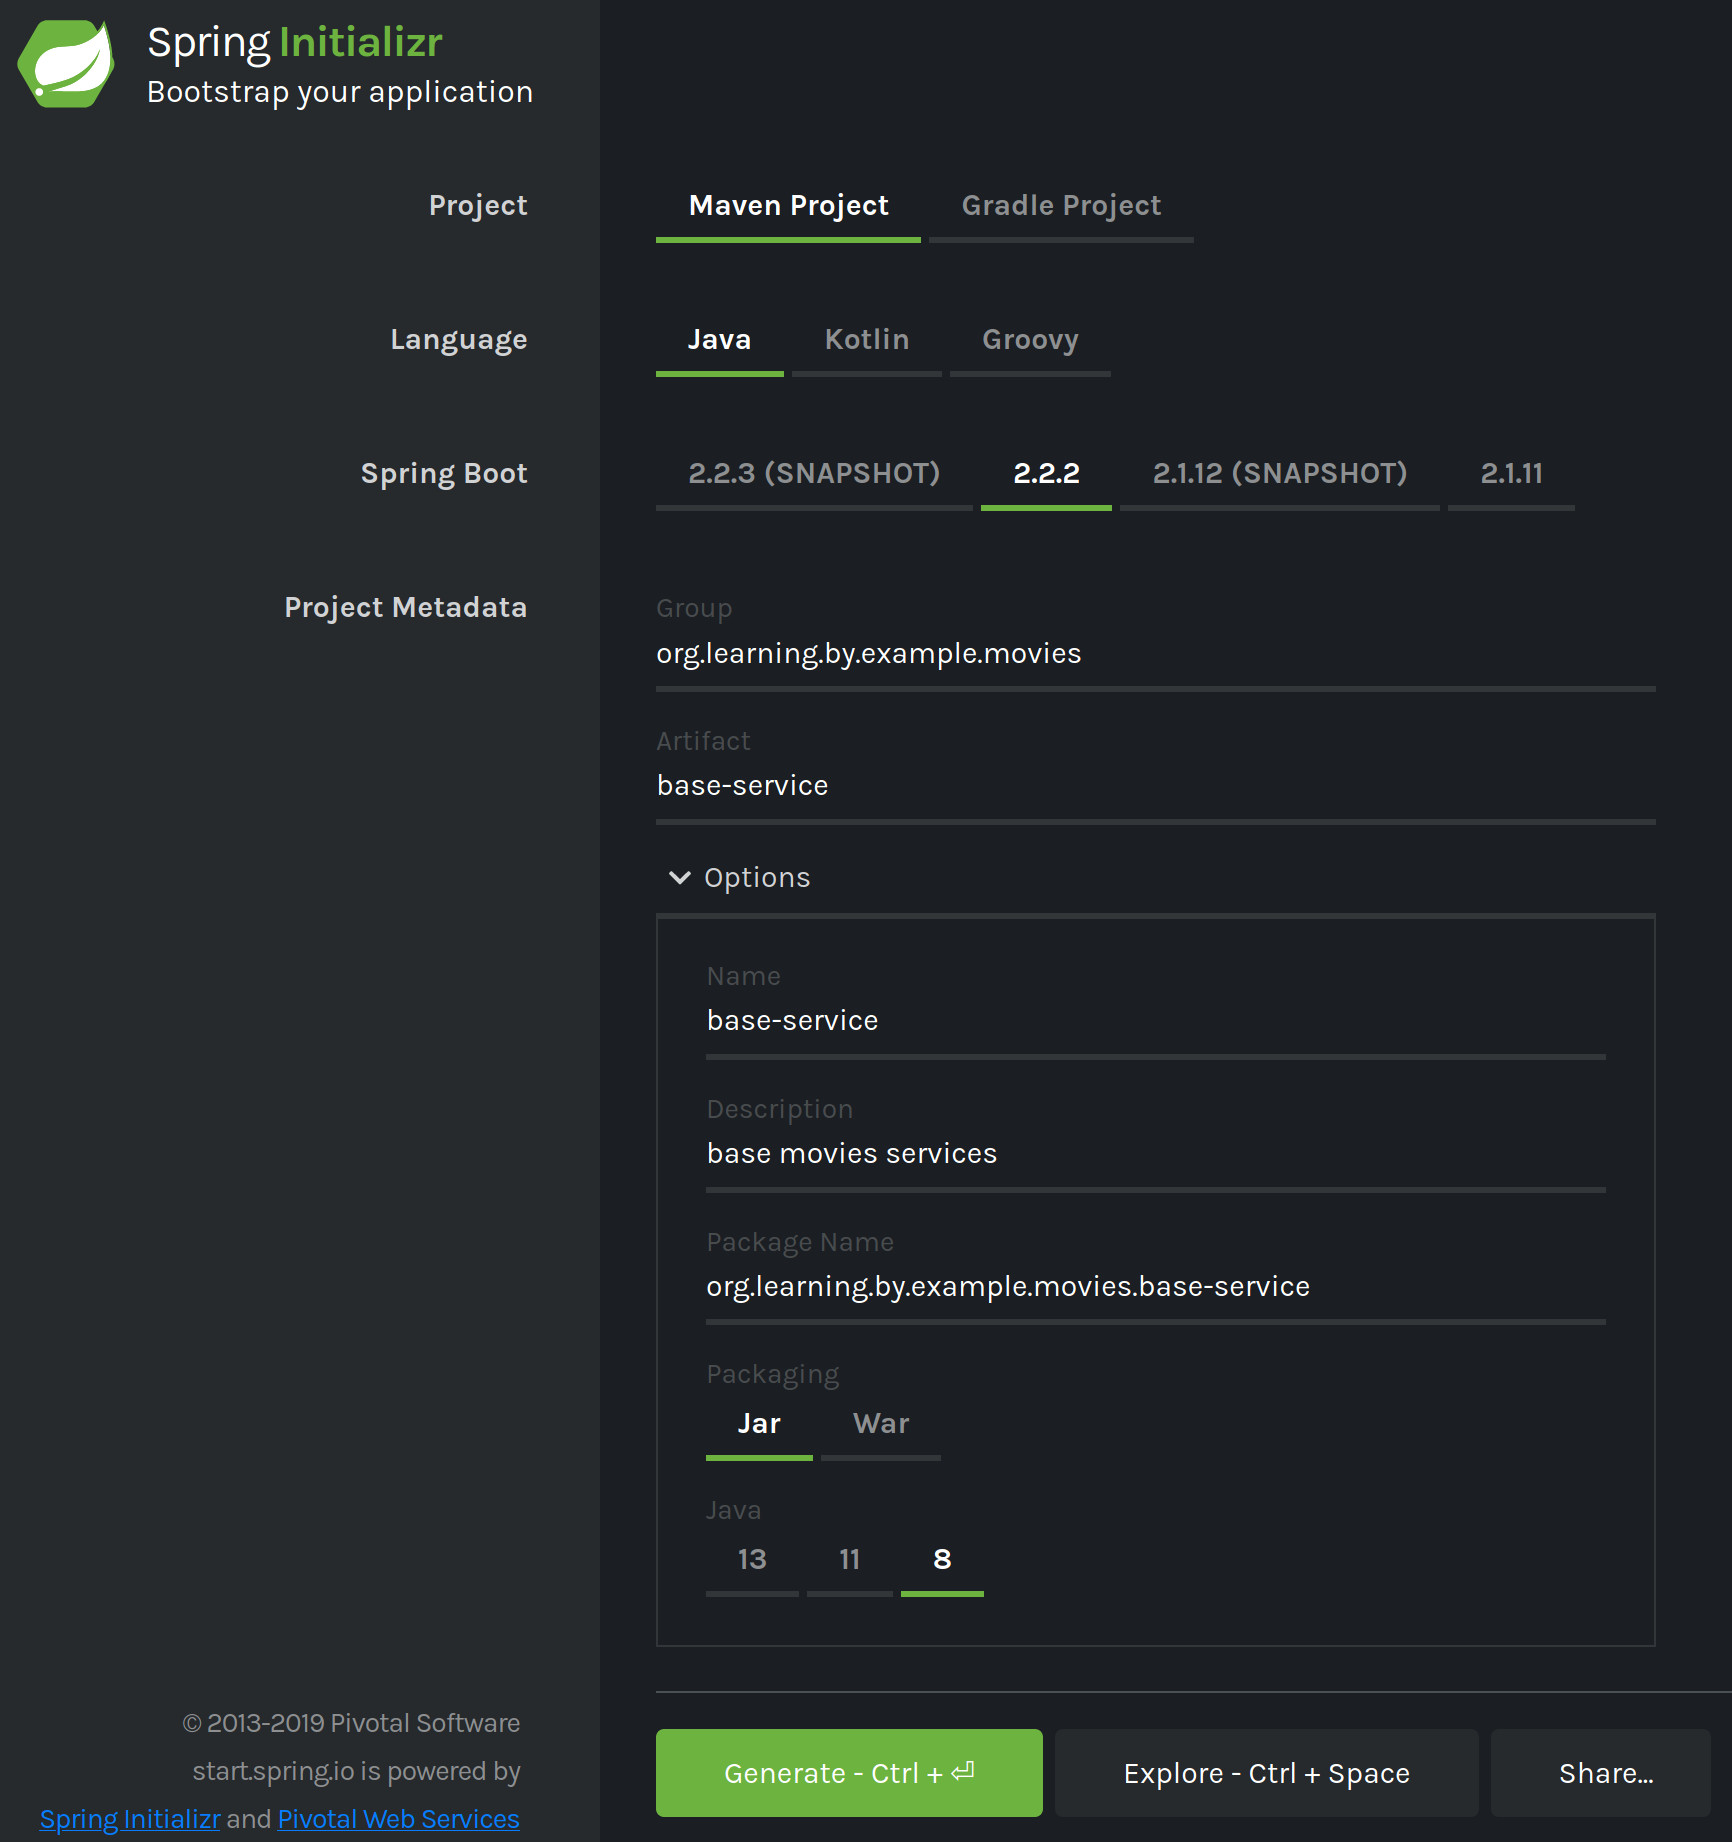
We are going to use Spring Initializr https://start.spring.io/ to quickly bootstrap our application.
We will create a Maven Project using Java 8 and Spring Boot version 2.2.2, we will set the Group to be org.learning.by.example.movies, and the Artifact to base-service, the rest of the values should be automatically populated.
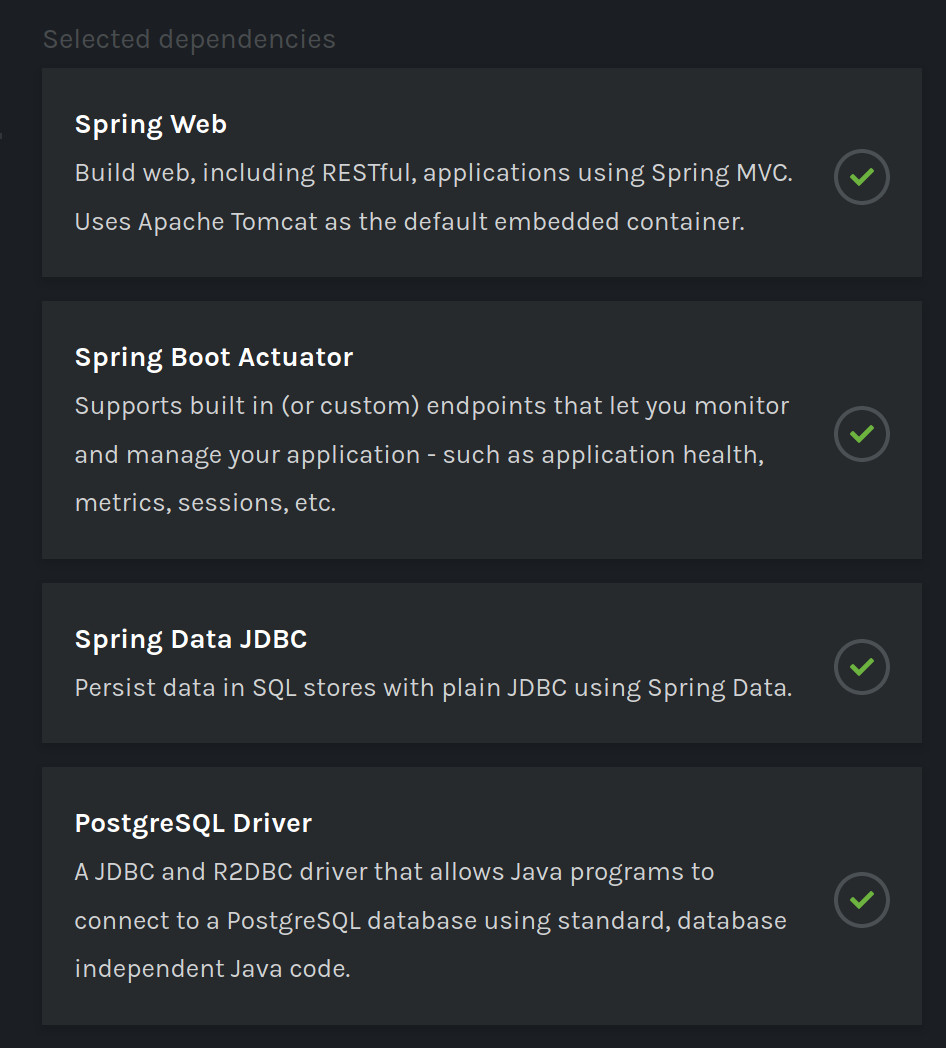
For dependencies we will search and add :
- Spring Web
- Spring Boot Actuator
- Spring Data JDBC
- PostgreSQL Driver
Now we will click on Generate to download our zip file : base-service.zip, we will uncompress it and leave it ready to be opened with our favorite IDE.
Designing the Service
Before starting to code our application we will design what our application will do, so first lest just look at our movies table loaded in our database, for this we will do as been doing before using just the PSQL client to explore the data.
Lest explore the data using PSQL, we will login in our server with our moviesuser user so we need to get it password, we could get it with:
$ microk8s.kubectl get secret moviesuser.movies-db-cluster.credentials -o 'jsonpath={.data.password}' | base64 -d
9oYUFcamSKwjB5Yrg099glLHdqg8C1IkScRfd5TeHTisiuj23FQrx3YEW6fB3ctJ
We will forward the PostgreSQL port 5432 on our master to our localhost port 6432, this will run until we do ctrl+c :
$ microk8s.kubectl port-forward movies-db-cluster-0 6432:5432
Forwarding from 127.0.0.1:6432 -> 5432
Forwarding from [::1]:6432 -> 5432
Finally we can connect to our database with with the provide user and password using PSQL in another shell :
$ psql -h localhost -p 6432 -U moviesuser movies
Password for user moviesuser:
psql (11.6 (Ubuntu 11.6-1.pgdg18.04+1), server 11.5 (Ubuntu 11.5-1.pgdg18.04+1))
SSL connection (protocol: TLSv1.3, cipher: TLS_AES_256_GCM_SHA384, bits: 256, compression: off)
Type "help" for help.

movies=# SELECT * FROM movies LIMIT 10;
 id |               title                |                   genres
----+------------------------------------+---------------------------------------------
  1 | Toy Story (1995)                   | Adventure|Animation|Children|Comedy|Fantasy
  2 | Jumanji (1995)                     | Adventure|Children|Fantasy
  3 | Grumpier Old Men (1995)            | Comedy|Romance
  4 | Waiting to Exhale (1995)           | Comedy|Drama|Romance
  5 | Father of the Bride Part II (1995) | Comedy
  6 | Heat (1995)                        | Action|Crime|Thriller
  7 | Sabrina (1995)                     | Comedy|Romance
  8 | Tom and Huck (1995)                | Adventure|Children
  9 | Sudden Death (1995)                | Action
 10 | GoldenEye (1995)                   | Action|Adventure|Thriller
(10 rows)

movies=# \q
As we can see we have a in our movies table a column id, as the key of each movie, a column name title that sometimes contains a year and a list of genres, separate with the the character |.
We will do a REST API that returns all the movies from a given genre, but since they are just in a column we need to prepare an special query for it.
SELECT
    id, title, genres
FROM
    movies
WHERE
    'sci-fi' = ANY(string_to_array(LOWER(genres),'|'))
We will use the PostgreSQL function string_to_array and the ANY operator for getting all the movies from a given genre, converted to lowercase using the string function lower.
This could return thousands of row, for example for sci-fi will be around 3.5k but that is what we like to do in our service.
Let’s check if with just 10 rows in PSQL
$ psql -h localhost -p 6432 -U moviesuser movies
Password for user moviesuser:
psql (11.6 (Ubuntu 11.6-1.pgdg18.04+1), server 11.5 (Ubuntu 11.5-1.pgdg18.04+1))
SSL connection (protocol: TLSv1.3, cipher: TLS_AES_256_GCM_SHA384, bits: 256, compression: off)
Type "help" for help.

movies=> SELECT
movies->     id, title, genres
movies-> FROM
movies->     movies
movies-> WHERE
movies->     'sci-fi' = ANY(string_to_array(LOWER(genres),'|'))
movies-> LIMIT 10;
 id  |                  title                   |                 genres
-----+------------------------------------------+------------------------------------------
  24 | Powder (1995)                            | Drama|Sci-Fi
  32 | Twelve Monkeys (a.k.a. 12 Monkeys) (1995)| Mystery|Sci-Fi|Thriller
  66 | Lawnmower Man 2: Beyond Cyberspace (1996)| Action|Sci-Fi|Thriller
  76 | Screamers (1995)                         | Action|Sci-Fi|Thriller
 103 | Unforgettable (1996)                     | Mystery|Sci-Fi|Thriller
 160 | Congo (1995)                             | Action|Adventure|Mystery|Sci-Fi
 172 | Johnny Mnemonic (1995)                   | Action|Sci-Fi|Thriller
 173 | Judge Dredd (1995)                       | Action|Crime|Sci-Fi
 196 | Species (1995)                           | Horror|Sci-Fi
 198 | Strange Days (1995)                      | Action|Crime|Drama|Mystery|Sci-Fi|Thriller
(10 rows)

movies=> \q
The query seems to work, now lets think on our API, we will create an endpoint in the url /movies/genre that will return all movies under that category as an array of JSON object, but this can not be directly the row in our database it should a bit better, we will design a movie JSON like this :
{
    "id": 24,
    "year": 1995,
    "genres": [
        "Drama",
        "Sci-Fi"
    ],
    "title": "Powder",
}
Implementing our Service
Back to our Service that was generated before we will open it in our favorite IDE and start adding the code require for our service to work.
First we will create a Plain Old Java Object, POJO, class that represents our Movie JSON Object, we will place it in src/main/java/org/learning/by/example/movies/baseservice/model/Movie.java :
package org.learning.by.example.movies.baseservice.model;

import java.util.List;

public class Movie {
    private final Integer id;
    private final String title;
    private final Integer year;
    private final List<String> genres;

    public Movie(final Integer id, final String title, final Integer year, List<String> genres) {
        this.id = id;
        this.title = title;
        this.year = year;
        this.genres = genres;
    }

    public Integer getId() {
        return id;
    }

    public String getTitle() {
        return title;
    }

    public Integer getYear() {
        return year;
    }

    public List<String> getGenres() {
        return genres;
    }
}
This class when deserialize will be just as our designed JSON, now we need we will create our repository that will query database on src/main/java/org/learning/by/example/movies/baseservice/repositories/MoviesRepository.java :
package org.learning.by.example.movies.baseservice.repositories;

import org.learning.by.example.movies.baseservice.model.Movie;
import org.springframework.data.jdbc.repository.query.Query;
import org.springframework.data.repository.CrudRepository;
import org.springframework.stereotype.Repository;

import java.util.List;

@Repository
public interface MoviesRepository extends CrudRepository<Movie, Integer> {
    @Query(value = "SELECT \n" +
            "  m.id, m.title, m.genres \n" +
            " FROM \n" +
            "  movies as m \n" +
            " WHERE :genre = ANY(string_to_array(LOWER(m.genres),'|')) \n")
    List<Movie> findByGenre(String genre);
}
In this simple repository we will extend from CrudRepository to return a Movie List giving a genre, we will use the query that we design before.
But the output of this query does not mach our Movie Classs so we need to create a mapper that will convert a row from our database, we will place on src/main/java/org/learning/by/example/movies/baseservice/mapper/MovieMapper.java :
package org.learning.by.example.movies.baseservice.mapper;

import org.learning.by.example.movies.baseservice.model.Movie;
import org.springframework.jdbc.core.RowMapper;
import org.springframework.stereotype.Component;

import java.sql.ResultSet;
import java.sql.SQLException;
import java.util.Arrays;
import java.util.List;
import java.util.regex.Matcher;
import java.util.regex.Pattern;
import java.util.stream.Collectors;

@Component
public class MovieMapper implements RowMapper<Movie> {
    // Without escape characters this pattern ins : (.*) \((\d{4})\)
    //  (       = START GROUP 1
    //  .*      = any set of characters
    //  )       = END GROUP 1
    //          = space
    //  \(      = the character (
    //  (       = START GROUP 2
    //  d{4}    = four digits, ex 1945
    //  )       = END GROUP 2
    //  \)      = the character )
    final static Pattern TITLE_YEAR_PATTERN = Pattern.compile("(.*) \\((\\d{4})\\)");

    @Override
    public Movie mapRow(final ResultSet resultSet, final int i) throws SQLException {
        final String rowTile = resultSet.getString("title");

        final String realTitle;
        final int year;

        final Matcher matcher = TITLE_YEAR_PATTERN.matcher(rowTile);
        if (matcher.find()) {
            realTitle = matcher.group(1);
            year = Integer.parseInt(matcher.group(2));
        } else {
            realTitle = rowTile;
            year = 1900;
        }

        final String[] genres = resultSet.getString("genres").split("\\|");
        final List<String> genresList = Arrays.stream(genres).filter(
                genre -> !genre.isEmpty()
        ).collect(Collectors.toList());

        final int id = resultSet.getInt("id");

        return new Movie(id, realTitle, year, genresList);
    }
}
This simple RowMapper will first use a regular expression to get our movie title and year, if it is available, parse the genres and produce a Movie object, however is not enough to have a mapper we need to tell Spring Data JDBC to use it when query for our Movies so we will set this in a new configuration class on src/main/java/org/learning/by/example/movies/baseservice/repositories/MappingConfiguration.java :
package org.learning.by.example.movies.baseservice.repositories;

import org.learning.by.example.movies.baseservice.mapper.MovieMapper;
import org.learning.by.example.movies.baseservice.model.Movie;
import org.springframework.context.annotation.Configuration;
import org.springframework.data.jdbc.repository.config.DefaultQueryMappingConfiguration;

@Configuration
public class MappingConfiguration extends DefaultQueryMappingConfiguration {
    MappingConfiguration(final MovieMapper movieMapper) {
        super();
        registerRowMapper(Movie.class, movieMapper);
    }
}
In this MappingConfiguration we are registering our MovieMapper for mapping Movies objects, note that we use dependency constructor injection for obtain the bean for our MovieMapper.
We will create now a service that will provide movies to who ever request them, to been able to change the implementation of our repository if needed and we will place it on src/main/java/org/learning/by/example/movies/baseservice/service/MovieService.java :
package org.learning.by.example.movies.baseservice.service;

import org.learning.by.example.movies.baseservice.model.Movie;
import org.learning.by.example.movies.baseservice.repositories.MoviesRepository;
import org.springframework.stereotype.Service;

import java.util.List;

@Service
public class MovieService {
    private final MoviesRepository repository;

    public MovieService(final MoviesRepository repository) {
        this.repository = repository;
    }

    public List<Movie> getMoviesByGenre(final String genre) {
        return repository.findByGenre(genre.toLowerCase());
    }
}
The MovieService class will as well convert to lowercase the genre, since our repository will be perform the query on lowercase genres.
Now we will create our api using a RestController and we will place it on src/main/java/org/learning/by/example/movies/baseservice/controller/MoviesController.java :
package org.learning.by.example.movies.baseservice.controller;

import org.learning.by.example.movies.baseservice.model.Movie;
import org.learning.by.example.movies.baseservice.service.MovieService;
import org.springframework.web.bind.annotation.GetMapping;
import org.springframework.web.bind.annotation.PathVariable;
import org.springframework.web.bind.annotation.RestController;

import java.util.List;

@RestController
public class MoviesController {
    private final MovieService movieService;

    public MoviesController(final MovieService movieService) {
        this.movieService = movieService;
    }

    @GetMapping("/movies/{genre}")
    List<Movie> getMovies(@PathVariable String genre) {
        return movieService.getMoviesByGenre(genre);
    }
}
Our MovieController will answer HTTP GET request on /movies/{genre} and return the movies using the MoviesService that will use our MoviesRepository, however we need to stablish the connection to our database but first let thinks how this will run on our k8s cluster.
When the service is running we need to connect to our database we could use the environment variables provide by kubernetes to connect to find the IP address and port, as we did in the last example, this are MOVIES_DB_CLUSTER_SERVICE_HOST and MOVIES_DB_CLUSTER_SERVICE_PORT_POSTGRESQL, but we need as well the credentials that we could inject in our kubernetes deployment, as we did before, in a directory containing a username and password. Finally we need to tell spring witch database driver to use, and the JDBC connection string, for this let’s add to our src/main/resources/application.yml some entries :
movies-datasource:
  driver: "org.postgresql.Driver"
  connection-string: "jdbc:postgresql://\
    ${MOVIES_DB_CLUSTER_SERVICE_HOST}:${MOVIES_DB_CLUSTER_SERVICE_PORT_POSTGRESQL}\
    /movies"
  credentials: "/etc/movies-db"
Let’s get those values using a ConfigurationProperties that will be on src/main/java/org/learning/by/example/movies/baseservice/datasource/DataSourceProperties.java :
package org.learning.by.example.movies.baseservice.datasource;

import org.springframework.boot.context.properties.ConfigurationProperties;
import org.springframework.stereotype.Component;

@Component
@ConfigurationProperties("movies-datasource")
public class DataSourceProperties {
    public String getDriver() {
        return driver;
    }

    public void setDriver(String driver) {
        this.driver = driver;
    }

    public String getConnectionString() {
        return connectionString;
    }

    public void setConnectionString(String connectionString) {
        this.connectionString = connectionString;
    }

    public String getCredentials() {
        return credentials;
    }

    public void setCredentials(String credentials) {
        this.credentials = credentials;
    }

    private String driver;
    private String connectionString;
    private String credentials;
}
Now that we have our DataSourceProperties we could create a DataSource for our connection on src/main/java/org/learning/by/example/movies/baseservice/datasource/MoviesDataSource.java :
package org.learning.by.example.movies.baseservice.datasource;

import org.apache.commons.logging.Log;
import org.apache.commons.logging.LogFactory;
import org.springframework.jdbc.datasource.DriverManagerDataSource;
import org.springframework.stereotype.Component;

import java.nio.file.Files;
import java.nio.file.Path;
import java.nio.file.Paths;

@Component
public class MoviesDataSource extends DriverManagerDataSource {
    private static final Log log = LogFactory.getLog(MoviesDataSource.class);

    MoviesDataSource(final DataSourceProperties dataSourceProperties) {
        super();
        this.setDriverClassName(dataSourceProperties.getDriver());
        setUrl(dataSourceProperties.getConnectionString());
        final String credentials = dataSourceProperties.getCredentials();
        this.setUsername(getCredentialValue(credentials, "username"));
        this.setPassword(getCredentialValue(credentials, "password"));
    }

    private String getCredentialValue(final String credentials, final String value) {
        final Path path = Paths.get(credentials, value);
        try {
            return new String(Files.readAllBytes(path));
        } catch (Exception ex) {
            throw new RuntimeException("error getting data source credential value : " + path.toString(), ex);
        }
    }
}
We are creating a DriverManagerDataSource with the settings in our application.yml and reading the username and password from our credentials directory.
Finally we will modify our application on src/main/java/org/learning/by/example/movies/baseservice/BaseServiceApplication.java :
package org.learning.by.example.movies.baseservice;

import org.springframework.boot.SpringApplication;
import org.springframework.boot.autoconfigure.SpringBootApplication;
import org.springframework.data.jdbc.repository.config.EnableJdbcRepositories;

@SpringBootApplication
@EnableJdbcRepositories
public class BaseServiceApplication {
    public static void main(String[] args) {
        SpringApplication.run(BaseServiceApplication.class, args);
    }
}
We just enable JDBC repositories in our application.
Note: For make this article brief we haven’t include the unit and integrations tests created for this code, but they are available on the repository for this article.
Running our Service in Local
Before start working on deploying the service into our k8s cluster we will run it locally, but since our configuration use a couple of environments variables and some credentials files for this.
First let’s get our user password with :
$ microk8s.kubectl get secret moviesuser.movies-db-cluster.credentials -o 'jsonpath={.data.password}' | base64 -d
9oYUFcamSKwjB5Yrg099glLHdqg8C1IkScRfd5TeHTisiuj23FQrx3YEW6fB3ctJ
Now will we save it to a file named /etc/movies-db/password, we will create as well a file name /etc/movies-db/username that just contains our user : moviesuser.
We will build our microservice with :
$ ./mvnw clean packageWe will forward the PostgreSQL port 5432 on our master to our localhost port 6432, this will run until we do ctrl+c :
$ microk8s.kubectl port-forward movies-db-cluster-0 6432:5432
Forwarding from 127.0.0.1:6432 -> 5432
Forwarding from [::1]:6432 -> 5432
In a new shell window we could run out service, this will run until we do ctrl+c :
$ export MOVIES_DB_CLUSTER_SERVICE_HOST="localhost"
$ export MOVIES_DB_CLUSTER_SERVICE_PORT_POSTGRESQL="6432"
$ java -jar target/base-service-0.0.1-SNAPSHOT.jar
Now we could test our service using any HTPP client, such wget, curl, etc., I going to use HTTPie instead :
$ http :8080/movies/sci-fi
HTTP/1.1 200
Connection: keep-alive
Content-Type: application/json
Date: Wed, 01 Jan 2020 12:13:46 GMT
Keep-Alive: timeout=60
Transfer-Encoding: chunked

[
    {
        "genres": [
            "Drama",
            "Sci-Fi"
        ],
        "id": 24,
        "title": "Powder",
        "year": 1995
    },
    {
        "genres": [
            "Adventure",
            "Drama",
            "Fantasy",
            "Mystery",
            "Sci-Fi"
        ],
        "id": 29,
        "title": "City of Lost Children, The (Cité des enfants perdus, La)",
        "year": 1995
    },
........
........
........
]
This will output thousands of records, these where just some of them.
But since we have as well include Spring Actuator in our dependencies we have two more URLs in our service :
$ http :8080/actuator/info
HTTP/1.1 200
Connection: keep-alive
Content-Type: application/vnd.spring-boot.actuator.v3+json
Date: Thu, 02 Jan 2020 16:34:58 GMT
Keep-Alive: timeout=60
Transfer-Encoding: chunked

{}

$ http :8080/actuator/health
HTTP/1.1 200
Connection: keep-alive
Content-Type: application/vnd.spring-boot.actuator.v3+json
Date: Thu, 02 Jan 2020 16:35:09 GMT
Keep-Alive: timeout=60
Transfer-Encoding: chunked

{
    "status": "UP"
}
Building our Docker Image
Now that we have test that our application runs correctly let’s create a docker image and push it to our local repository that we have in our cluster, first we will create a Dockerfile :
FROM openjdk:8-jdk

COPY target/*.jar /usr/app/app.jar
WORKDIR /usr/app

CMD ["java", "-jar", "app.jar"]
Now we will create a small script that build our docker and publish it to the registry, we will name it build.sh :
#!/bin/sh -

set -o errexit

echo "doing maven build"
./mvnw clean package
echo "maven build done"

echo "building docker"
docker build . -t localhost:32000/movies-base-service:0.0.1
echo "docker builded"

echo "publishing docker"
docker push localhost:32000/movies-base-service
echo "docker published"
Running this script we will build our docker image and push to our local docker registry, but for deploying the image into our cluster we will create a deployment descriptor name deployment.yml :
apiVersion: apps/v1
kind: Deployment
metadata:
  creationTimestamp: null
  labels:
    app: movies-base-service
  name: movies-base-service
spec:
  replicas: 1
  selector:
    matchLabels:
      app: movies-base-service
  strategy: {}
  template:
    metadata:
      creationTimestamp: null
      labels:
        app: movies-base-service
    spec:
      containers:
        - image: localhost:32000/movies-base-service:0.0.1
          imagePullPolicy: Always
          name: movies-base-service
          resources: {}
          readinessProbe:
            httpGet:
              path: /actuator/health
              port: 8080
          livenessProbe:
            httpGet:
              path: /actuator/info
              port: 8080
          volumeMounts:
            - name: db-credentials
              mountPath: "/etc/movies-db"
              readOnly: true
            - name: tmp
              mountPath: "/tmp"
              readOnly: false
      volumes:
        - name: db-credentials
          secret:
            secretName: moviesuser.movies-db-cluster.credentials
        - name: tmp
          emptyDir: {}
status: {}
---
apiVersion: v1
kind: Service
metadata:
  creationTimestamp: null
  labels:
    app: movies-base-service
  name: movies-base-service
spec:
  ports:
    - name: 8080-8080
      port: 8080
      protocol: TCP
      targetPort: 8080
  selector:
    app: movies-base-service
  type: ClusterIP
status:
  loadBalancer: {}
In this descriptor we are first deploying our service, we declare our liveness and readiness probes to use our actuator endpoint, we inject our credentials and we mount a temporary directory for our service to use. Them we create a k8s service with a load balancer to been able to call our service and balance between the pods that is available.
Finally we will create another script to deploy our service deploy.sh :
#!/bin/sh -

set -o errexit

KUBECMD="kubectl"
if [ -x "$(command -v microk8s.kubectl)" ]; then
  KUBECMD="microk8s.kubectl"
fi

echo "deleting previous versions"
$KUBECMD delete all --selector=app=movies-base-service
echo "previous version deleted"

echo "create deployment"
$KUBECMD create -f deployment.yml
echo "deployment created"
This script is a bit different we have create in other tu use the standard kubectl or microk8.kubectl if its available, it will delete the deployment and them deploy our service.
We can now build and deploy our service with :
$ ./build.sh
$ ./deploy.sh
Now we could check what we have in our cluster for our service with :
$ microk8s.kubectl get all --selector=app=movies-base-service
NAME                                       READY   STATUS    RESTARTS   AGE
pod/movies-base-service-84cf9b8746-pj4xn   1/1     Running   0          4m40s

NAME                          TYPE        CLUSTER-IP       EXTERNAL-IP   PORT(S)    AGE
service/movies-base-service   ClusterIP   10.152.183.244   <none>        8080/TCP   4m40s

NAME                                  READY   UP-TO-DATE   AVAILABLE   AGE
deployment.apps/movies-base-service   1/1     1            1           4m40s

NAME                                             DESIRED   CURRENT   READY   AGE
replicaset.apps/movies-base-service-84cf9b8746   1         1         1       4m40s
Creating a load test
We have our service but in other to understand how it perform we will create an load test, we will start download Apache JMeter visiting the download page : https://jmeter.apache.org/download_jmeter.cgi
Now let’s unzip it and set in path that we could use :
$ sudo mkdir /opt/jmeter
$ cd /opt/jmeter
$ sudo unzip ~/Downloads/apache-jmeter*.zip
$ sudo ln -s apache-jmeter-5.2.1 default
$ sudo ln -s /opt/jmeter/default/bin/jmeter /usr/local/bin/jmeter
$ sudo chmod -R ugo+rw /opt/jmeter
With this now we have available jmeter to be use, however if you are using are high dpi screen, such a 4k or a retina display the JMeter UI may be to small to read but you could edit the file /opt/jmeter/default/bin/user.properties and add this:
jmeter.hidpi.mode=true
jmeter.hidpi.scale.factor=2.0
jmeter.toolbar.icons.size=48x48
jmeter.tree.icons.size=32x32
jsyntaxtextarea.font.family=Hack
jsyntaxtextarea.font.size=14
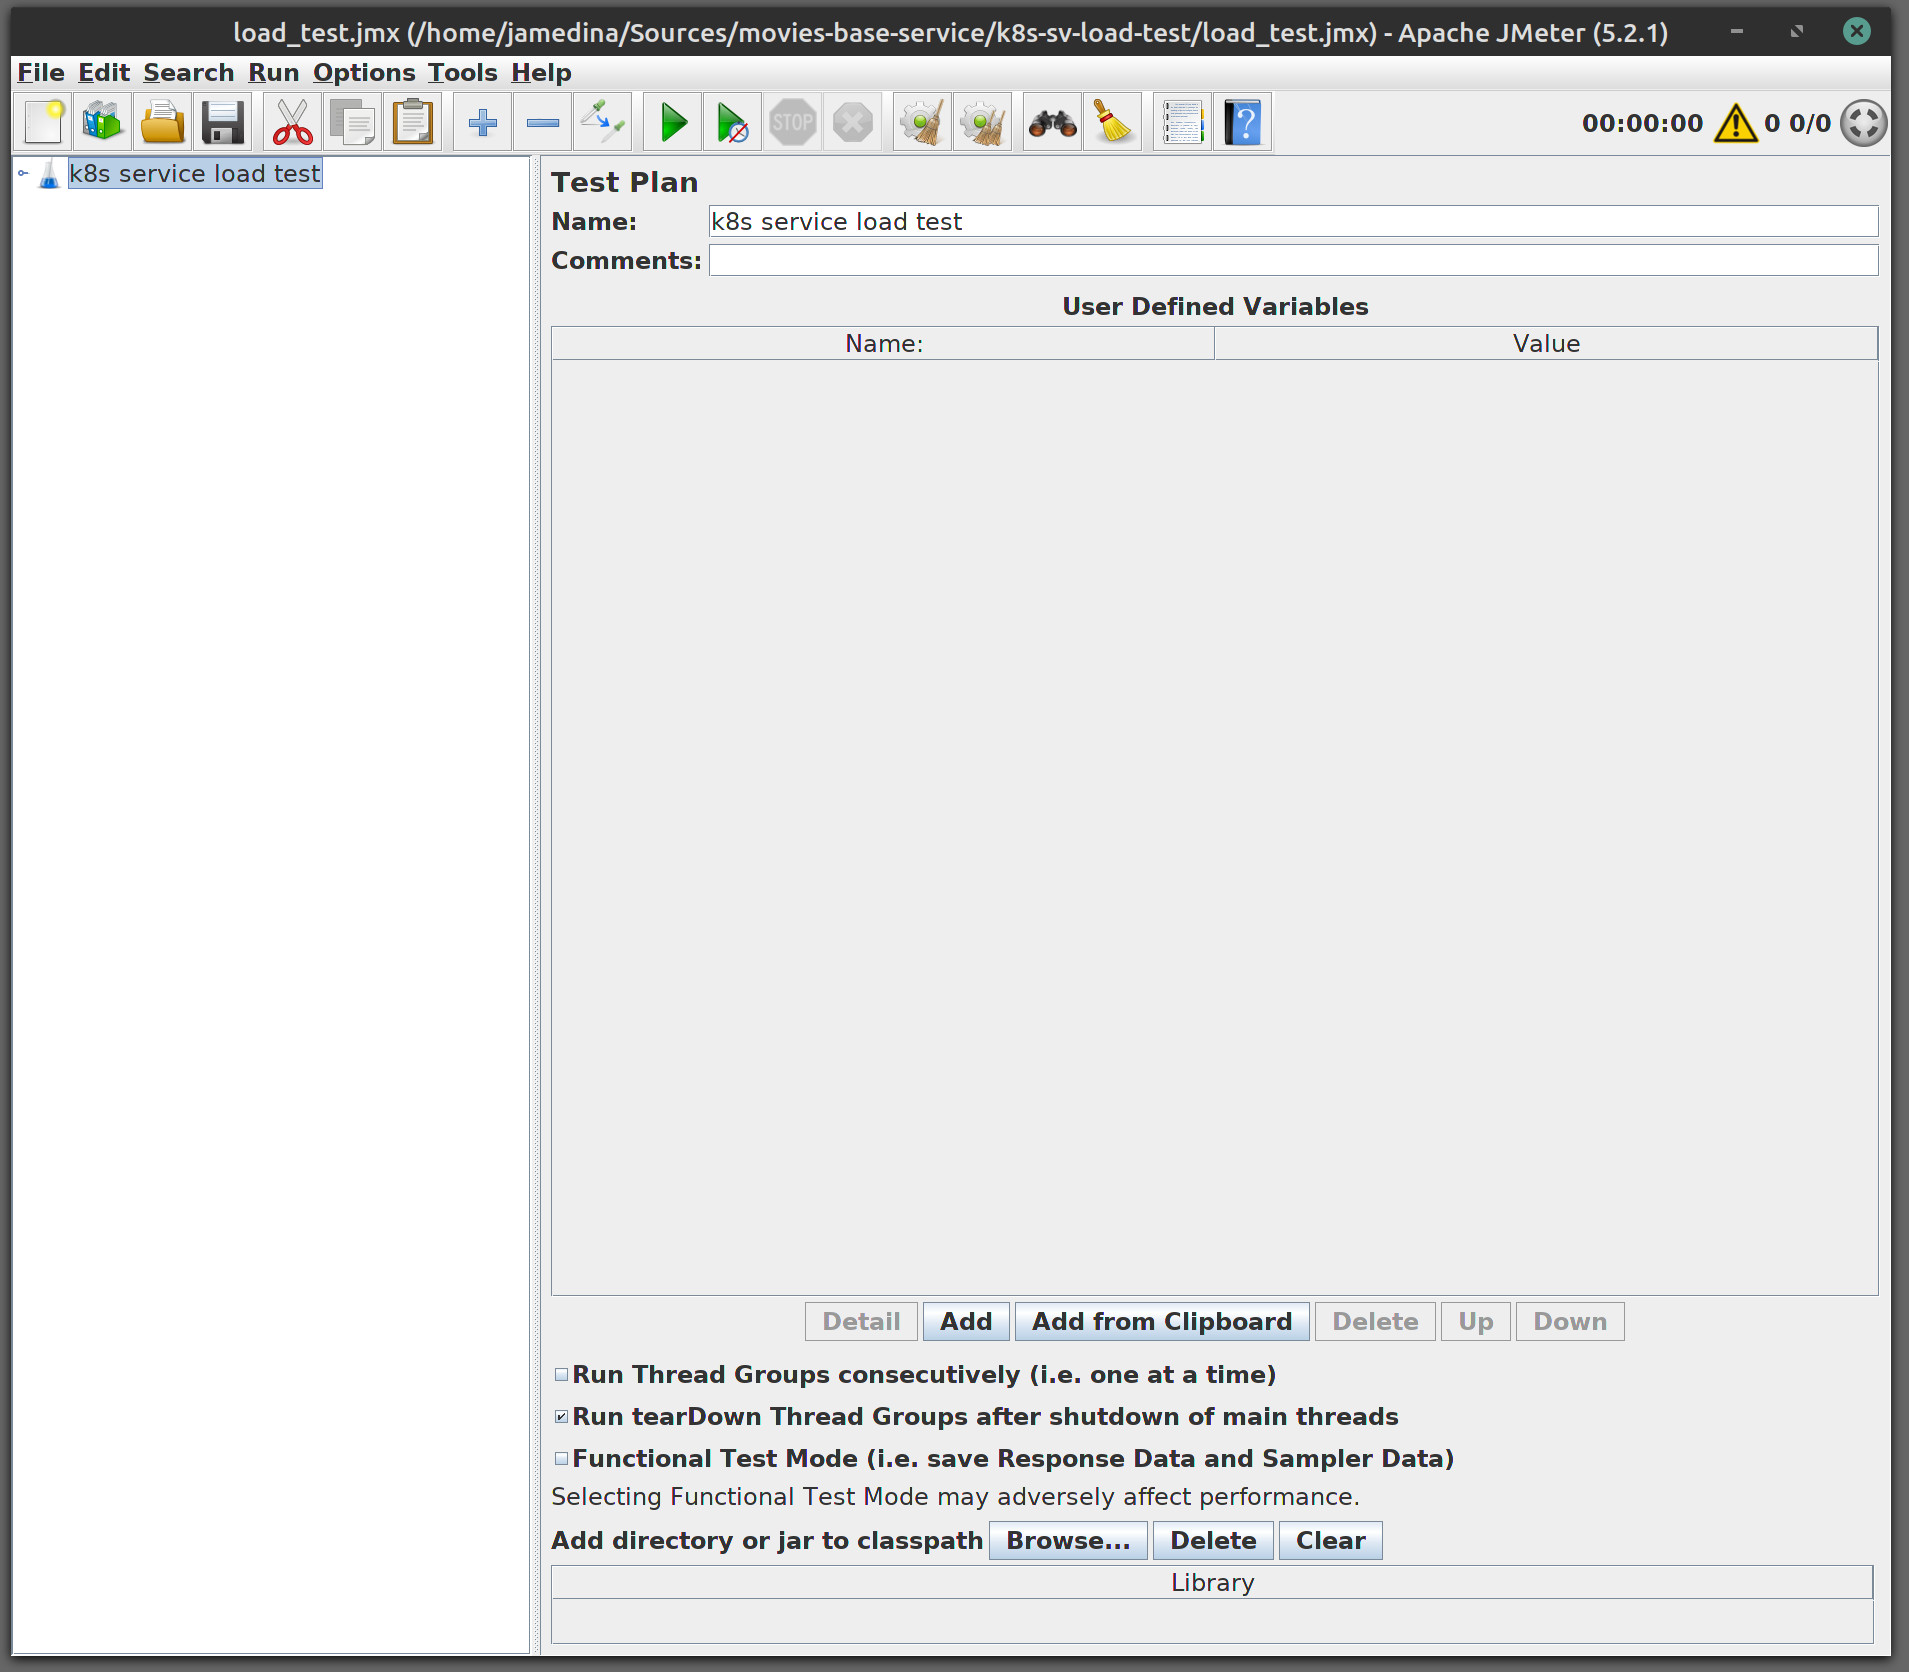
Now we could execute jmeter, it will open we a empty test plan, lest just on Name : k8s service load test
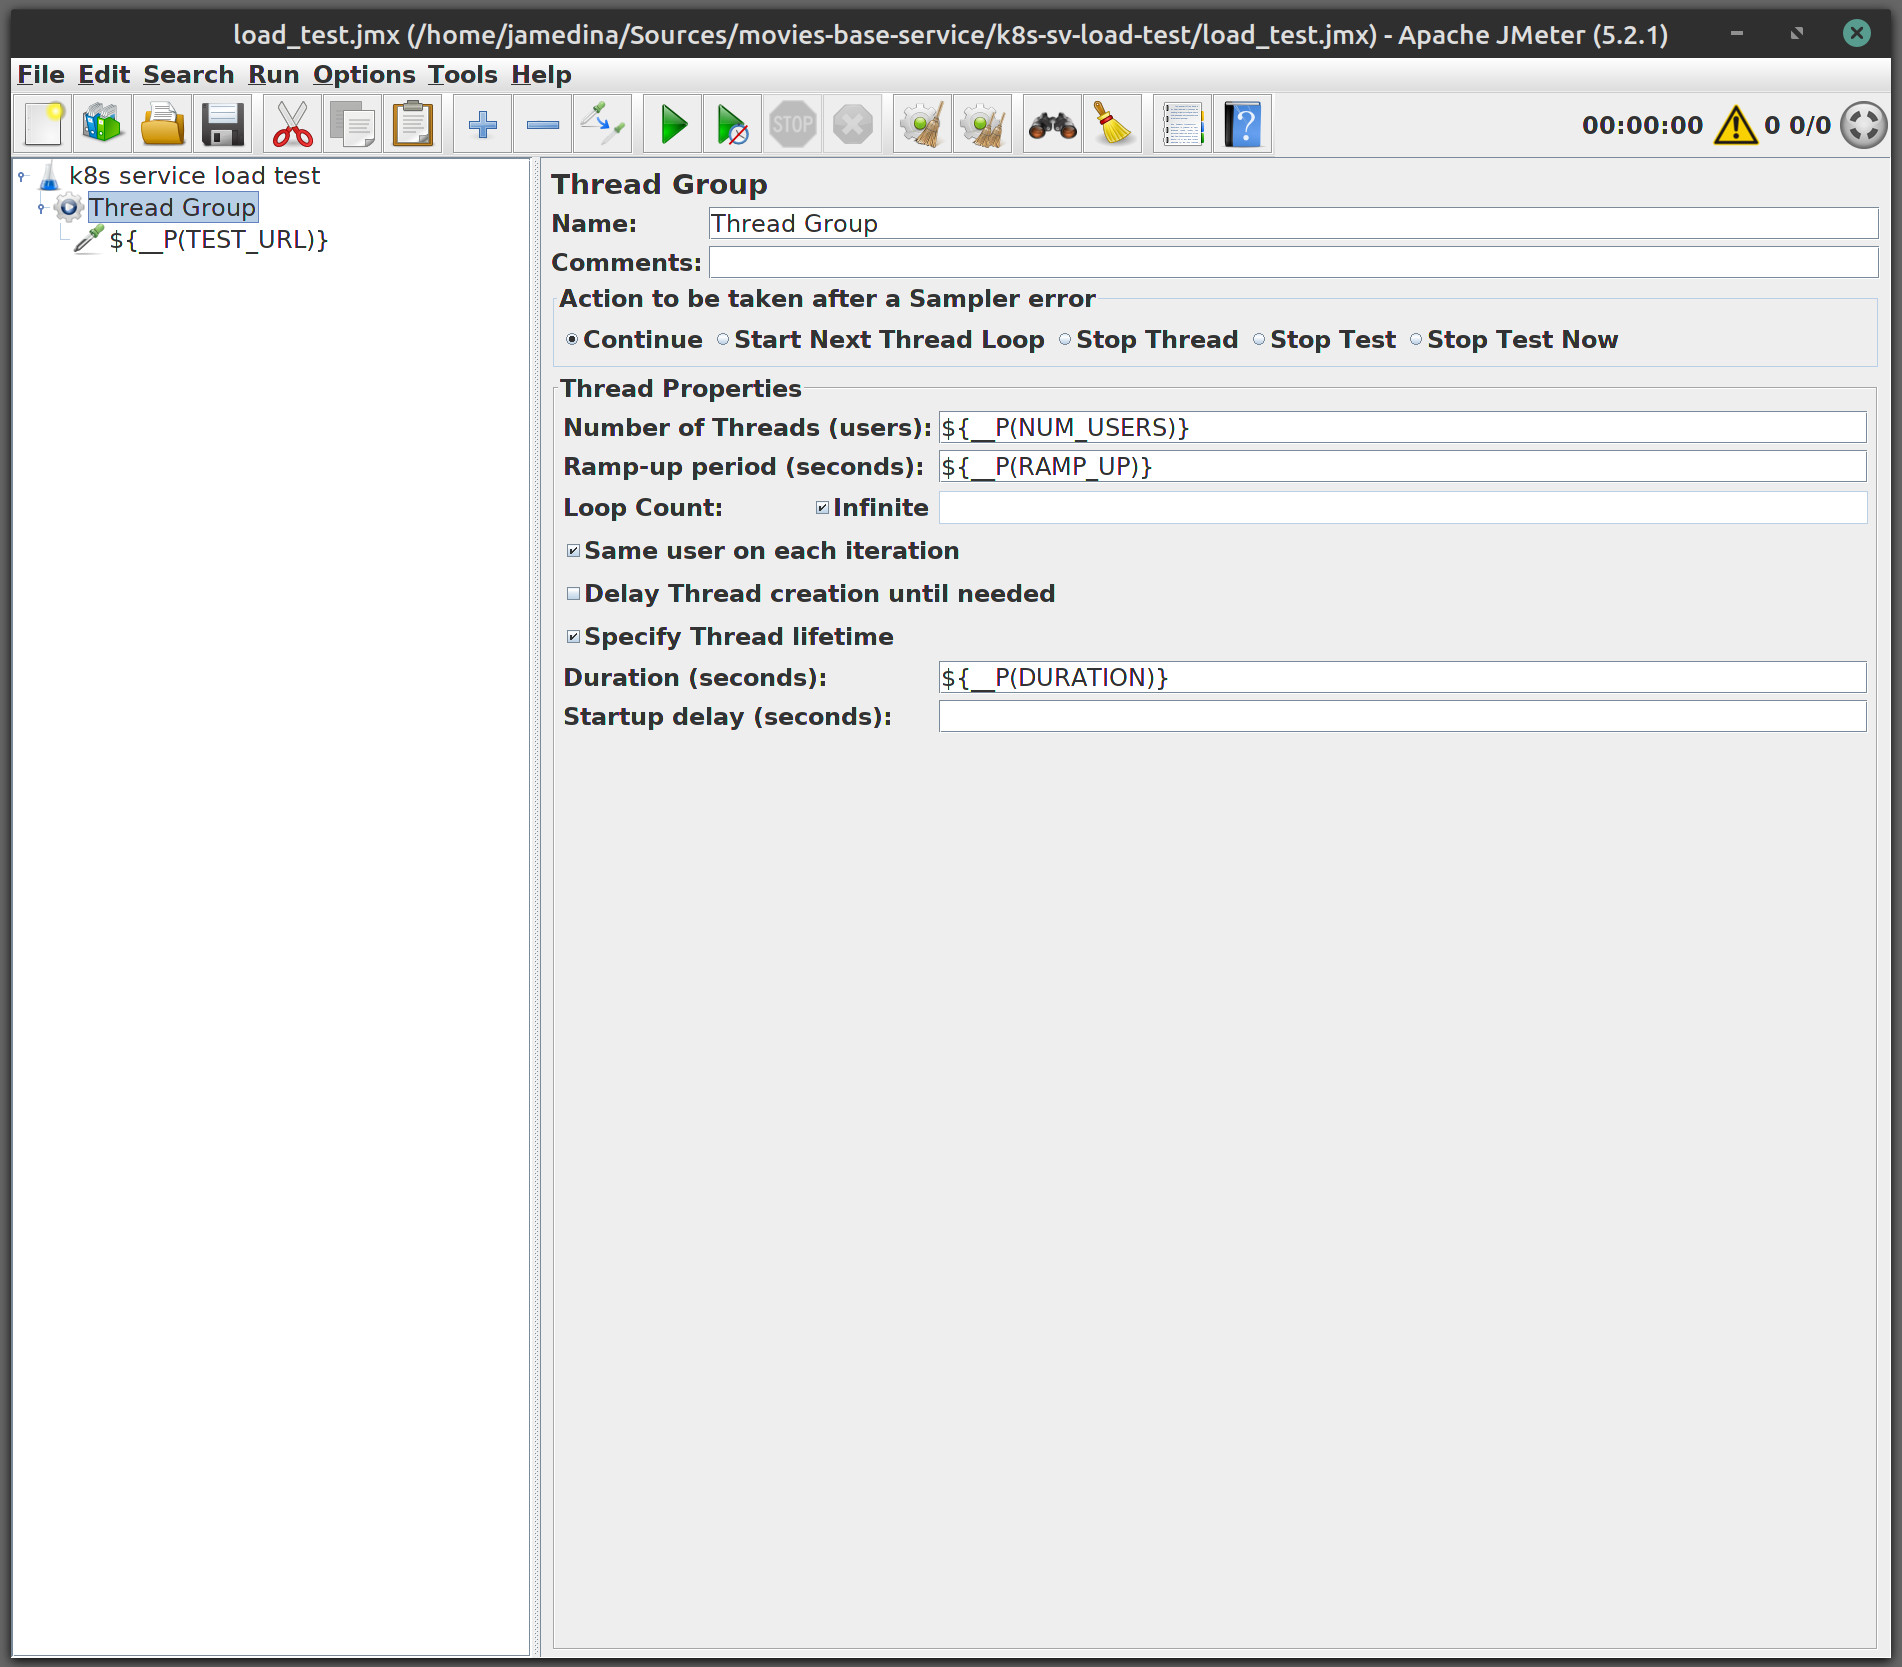
We will add a new thread group, right click on the tree panel on k8s service load test and select : Add > Thread (Users) -> Thread Group. Them we will set Number of Threads (Users) = ${__P(NUM_USERS)}, Ramp-up period (seconds) = ${__P(RAMP_UP)}, Loop Count = Infinite, Specify Thread lifetime = Checked, Duration (Seconds) = ${__P(DURATION)}.
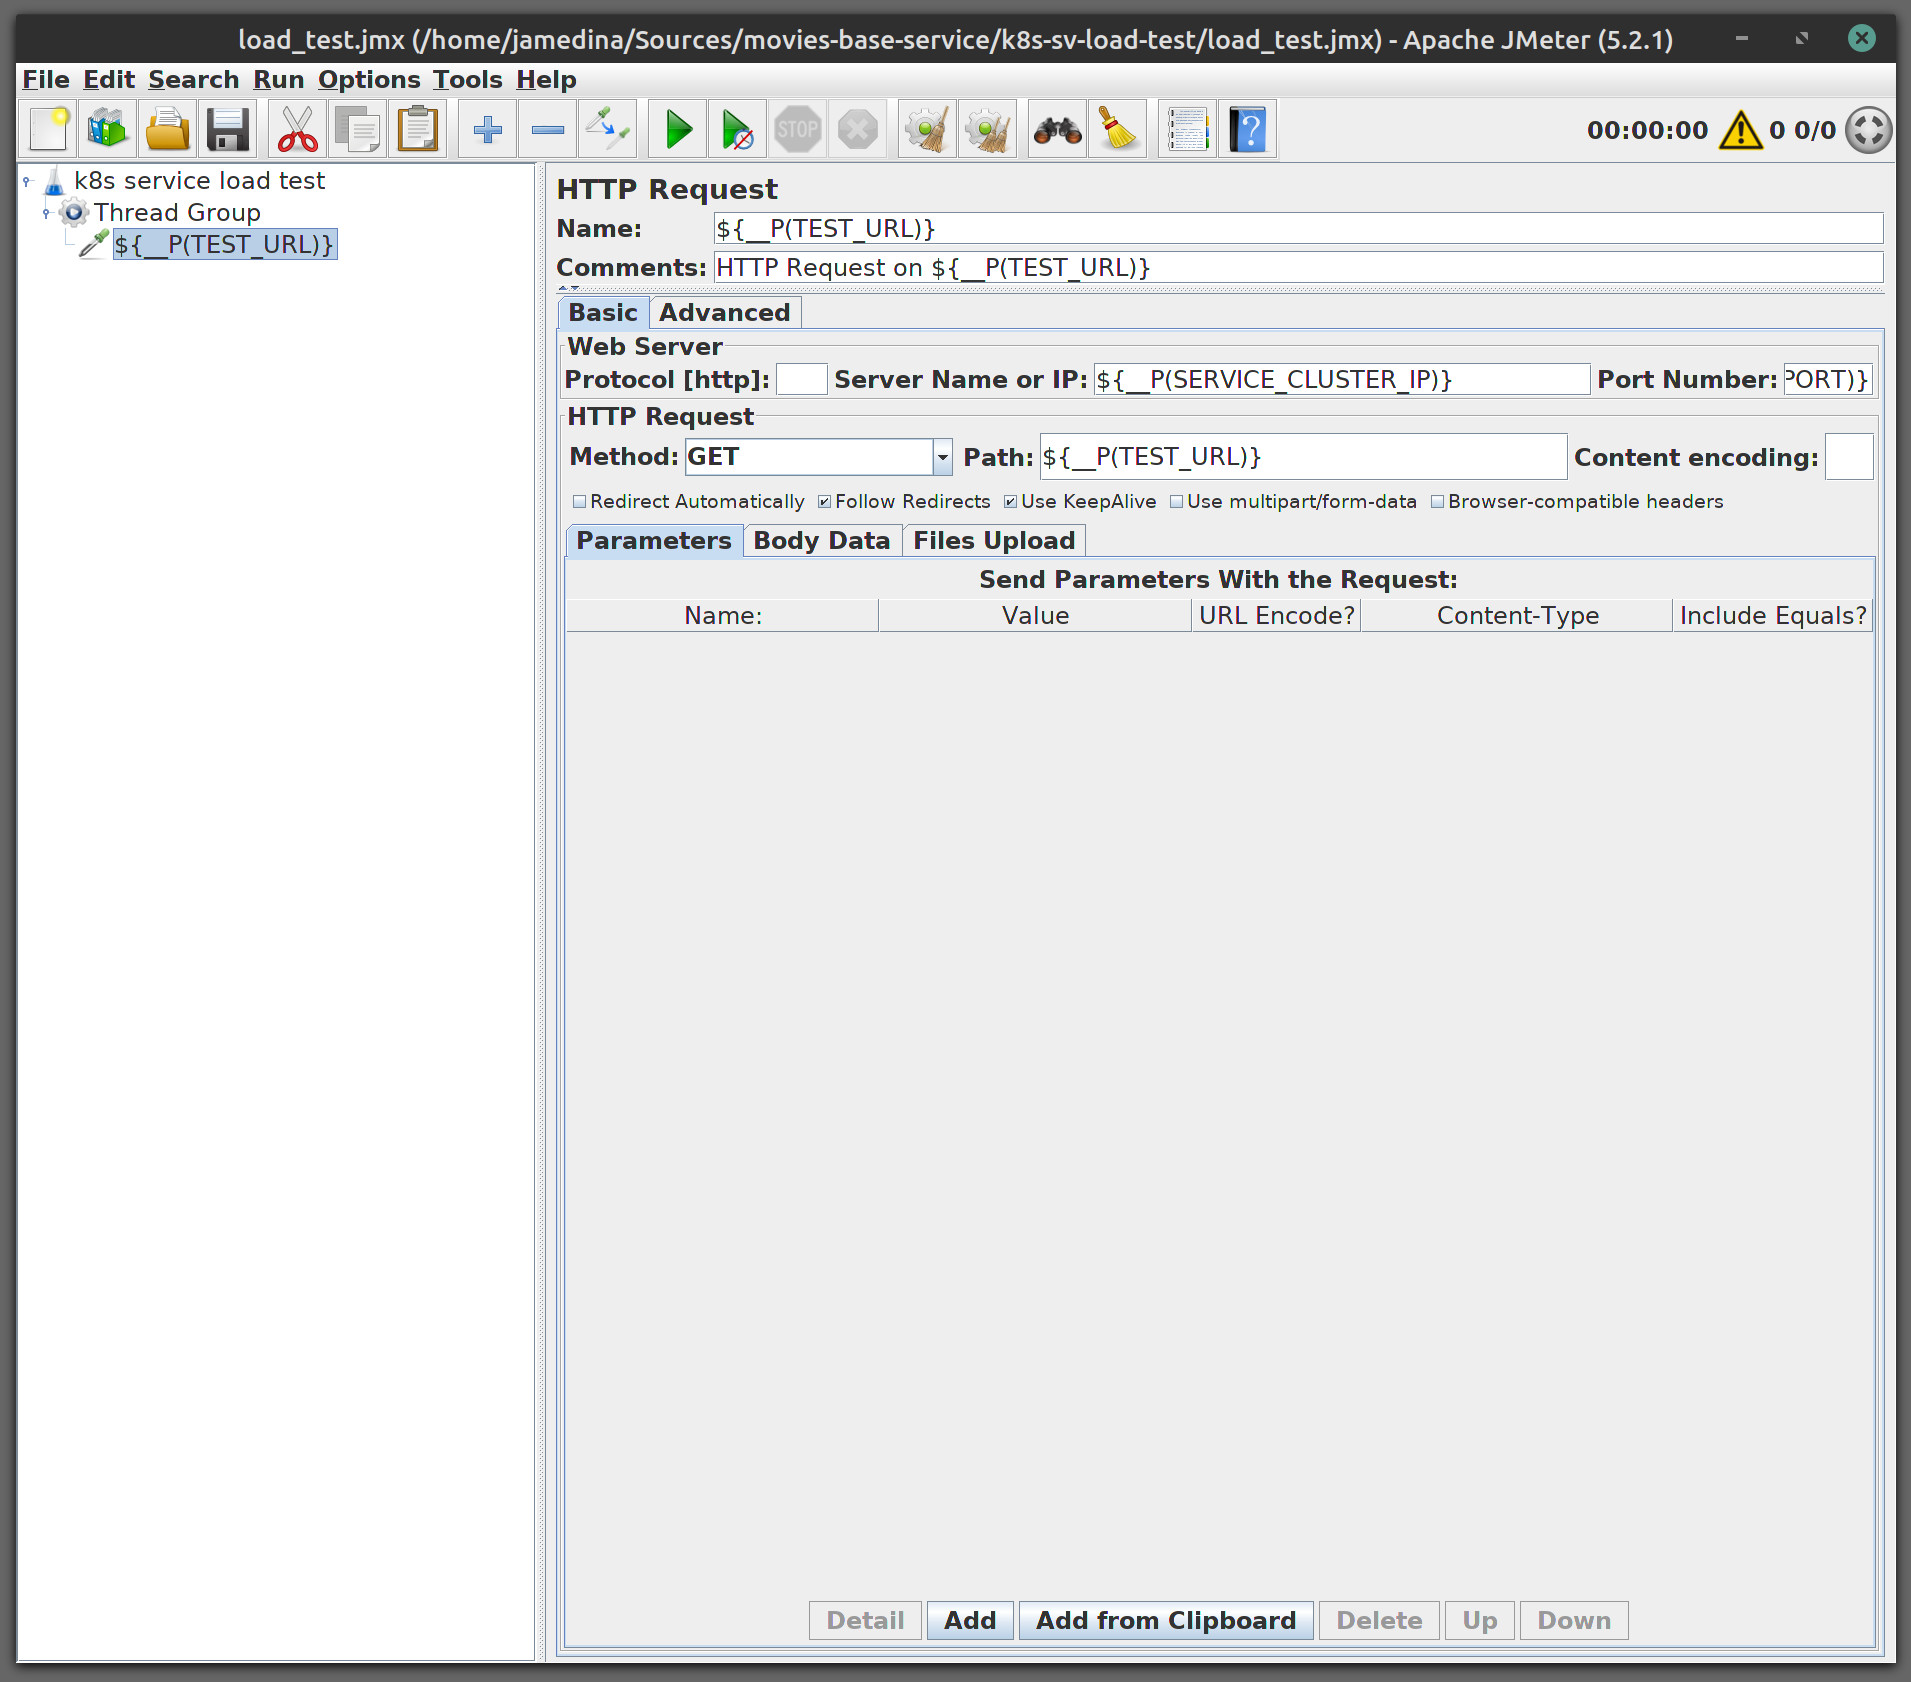
No we need to add a HTTP request, right click on the tree pane on Thread Group : Add > Sampler > HTTP Request. Them we will set Name = ${__P(TEST_URL)}, Server Name or IP = ${__P(SERVICE_CLUSTER_IP)}, Port Number = ${__P(SERVICE_PORT)}, Method = Get, Path = ${__P(TEST_URL)}.
Now we will save our plan on k8s-sv-load-test/load_test.jmx.
For launching our load test we wil create a new script on k8s-sv-load-test/k8s-sv-load-test.sh :
#!/bin/sh -

set -o errexit

if [ $# -ne 5 ]; then
  echo "Illegal number of parameters, usage : "
  echo " "
  echo "  $0 <service> <path> <users> <duration> <ramp up>"
  echo " "
  echo " example: "
  echo "  - $0 k8s-service /get/something 20 300 60"
  exit 2
fi

KUBECMD="kubectl"
if [ -x "$(command -v microk8s.kubectl)" ]; then
  KUBECMD="microk8s.kubectl"
fi

LOAD_DIR="$(
  cd "$(dirname "$0")"
  pwd -P
)"
REPORT_DIR="$LOAD_DIR/report"

if [ -d "$REPORT_DIR" ]; then
  echo "deleting report directory"
  rm -Rf "$REPORT_DIR"
  echo "report directory deleted"
fi

echo "creating report directory"
mkdir "$REPORT_DIR"
echo "report directory created"

SERVICE=$1
TEST_URL=$2
SERVICE_CLUSTER_IP=$($KUBECMD get "service/$SERVICE" -o jsonpath='{.spec.clusterIP}')
SERVICE_PORT=$($KUBECMD get "service/$SERVICE" -o jsonpath='{.spec.ports.*.targetPort}')
NUM_USERS=$3
DURATION=$4
RAMP_UP=$5

echo "launching a load test on http://$SERVICE_CLUSTER_IP:$SERVICE_PORT$TEST_URL with $NUM_USERS "\
  "user(s) during $DURATION seconds, ramping up during $RAMP_UP seconds"

HEAP="-Xms1g -Xmx1g -XX:MaxMetaspaceSize=256m"
jmeter -n -t "$LOAD_DIR/load_test.jmx" -l "$REPORT_DIR/run.jtl" -e -o "$REPORT_DIR" -j "$LOAD_DIR/jmeter.log" \
  -JSERVICE_CLUSTER_IP="$SERVICE_CLUSTER_IP" \
  -JSERVICE_PORT="$SERVICE_PORT" \
  -JNUM_USERS="$NUM_USERS" \
  -JDURATION="$DURATION" \
  -JRAMP_UP="$RAMP_UP" \
  -JTEST_URL="$TEST_URL"

echo "load test done"

WEB_REPORT_PATH="file:///$REPORT_DIR/index.html"
echo "report available on $WEB_REPORT_PATH"
This is a very generic script that allow to test any k8s that we have in our cluster, for example if we like to launch a load test against our movies service in the actuator/info endpoint during 30s that will ramp up in 1s :
$ ./k8s-sv-load-test/k8s-sv-load-test.sh movies-base-service /actuator/info 1 30 1
deleting report directory
report directory deleted
creating report directory
report directory created
launching a load test on http://10.152.183.244:8080/actuator/info with 1  user(s) during 30 seconds, ramping up during 1 seconds
Creating summariser <summary>
Created the tree successfully using /home/jamedina/Sources/movies-base-service/k8s-sv-load-test/load_test.jmx
Starting standalone test @ Thu Jan 02 18:25:14 GMT 2020 (1577989514103)
Waiting for possible Shutdown/StopTestNow/HeapDump/ThreadDump message on port 4445
Warning: Nashorn engine is planned to be removed from a future JDK release
summary +  88707 in 00:00:16 = 5632.2/s Avg:     0 Min:     0 Max:    16 Err:     0 (0.00%) Active: 1 Started: 1 Finished: 0
summary +  91647 in 00:00:14 = 6427.8/s Avg:     0 Min:     0 Max:     2 Err:     0 (0.00%) Active: 0 Started: 1 Finished: 1
summary = 180354 in 00:00:30 = 6010.0/s Avg:     0 Min:     0 Max:    16 Err:     0 (0.00%)
Tidying up ...    @ Thu Jan 02 18:25:44 GMT 2020 (1577989544259)
... end of run
load test done
report available on file:////home/jamedina/Sources/movies-base-service/k8s-sv-load-test/report/index.html
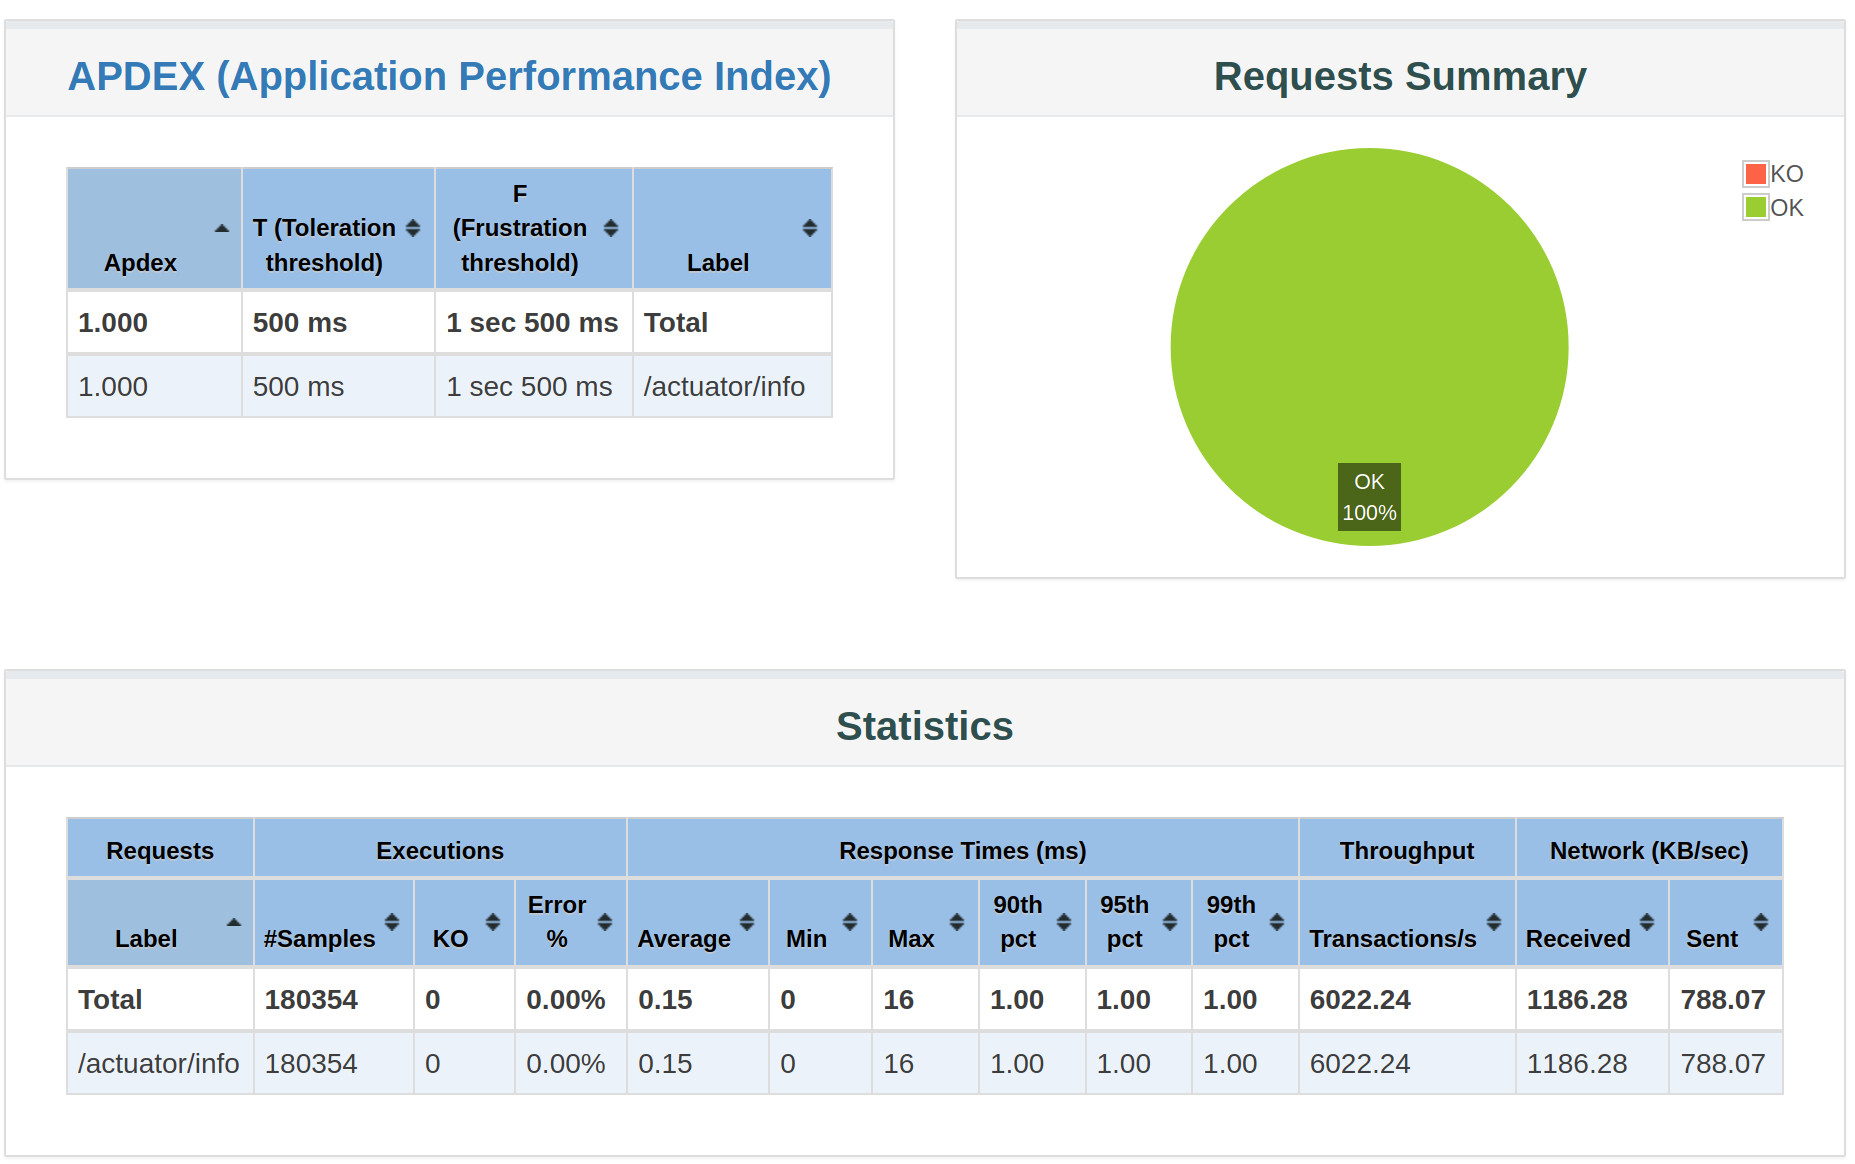
When the test is complet we get a nice report in html, in this example was on file:////home/jamedina/Sources/movies-base-service/k8s-sv-load-test/report/index.html
But this is a generic script so lets create a more specific to test our movies/genre endpoint on load-test.sh :
#!/bin/sh -

set -o errexit

if [ $# -ne 3 ]; then
    echo "Illegal number of parameters, usage : "
    echo " "
    echo "  $0 <users> <duration> <ramp up>"
    echo " "
    echo " example: "
    echo "  - $0 20 300 60"
    exit 2
fi

SERVICE="movies-base-service"
TEST_URL="/movies/sci-fi"
NUM_USERS=$1
DURATION=$2
RAMP_UP=$3

./k8s-sv-load-test/k8s-sv-load-test.sh $SERVICE $TEST_URL $NUM_USERS $DURATION $RAMP_UP
Now that we have our script ready we could launch it with
 ./load-test.sh 1 30 1
deleting report directory
report directory deleted
creating report directory
report directory created
launching a load test on http://10.152.183.252:8080/movies/sci-fi with 1  user(s) during 30 seconds, ramping up during 1 seconds
Creating summariser <summary>
Created the tree successfully using /home/jamedina/src/movies-base-service/k8s-sv-load-test/load_test.jmx
Starting standalone test @ Sat Jan 11 08:46:22 GMT 2020 (1578732382783)
Waiting for possible Shutdown/StopTestNow/HeapDump/ThreadDump message on port 4445
Warning: Nashorn engine is planned to be removed from a future JDK release
summary +    164 in 00:00:07 =   23.2/s Avg:    42 Min:    40 Max:    65 Err:     0 (0.00%) Active: 1 Started: 1 Finished: 0
summary +    570 in 00:00:23 =   24.8/s Avg:    40 Min:    38 Max:    59 Err:     0 (0.00%) Active: 0 Started: 1 Finished: 1
summary =    734 in 00:00:30 =   24.4/s Avg:    40 Min:    38 Max:    65 Err:     0 (0.00%)
Tidying up ...    @ Sat Jan 11 08:46:52 GMT 2020 (1578732412977)
... end of run
load test done
report available on file:////home/jamedina/src/movies-base-service/k8s-sv-load-test/report/index.html
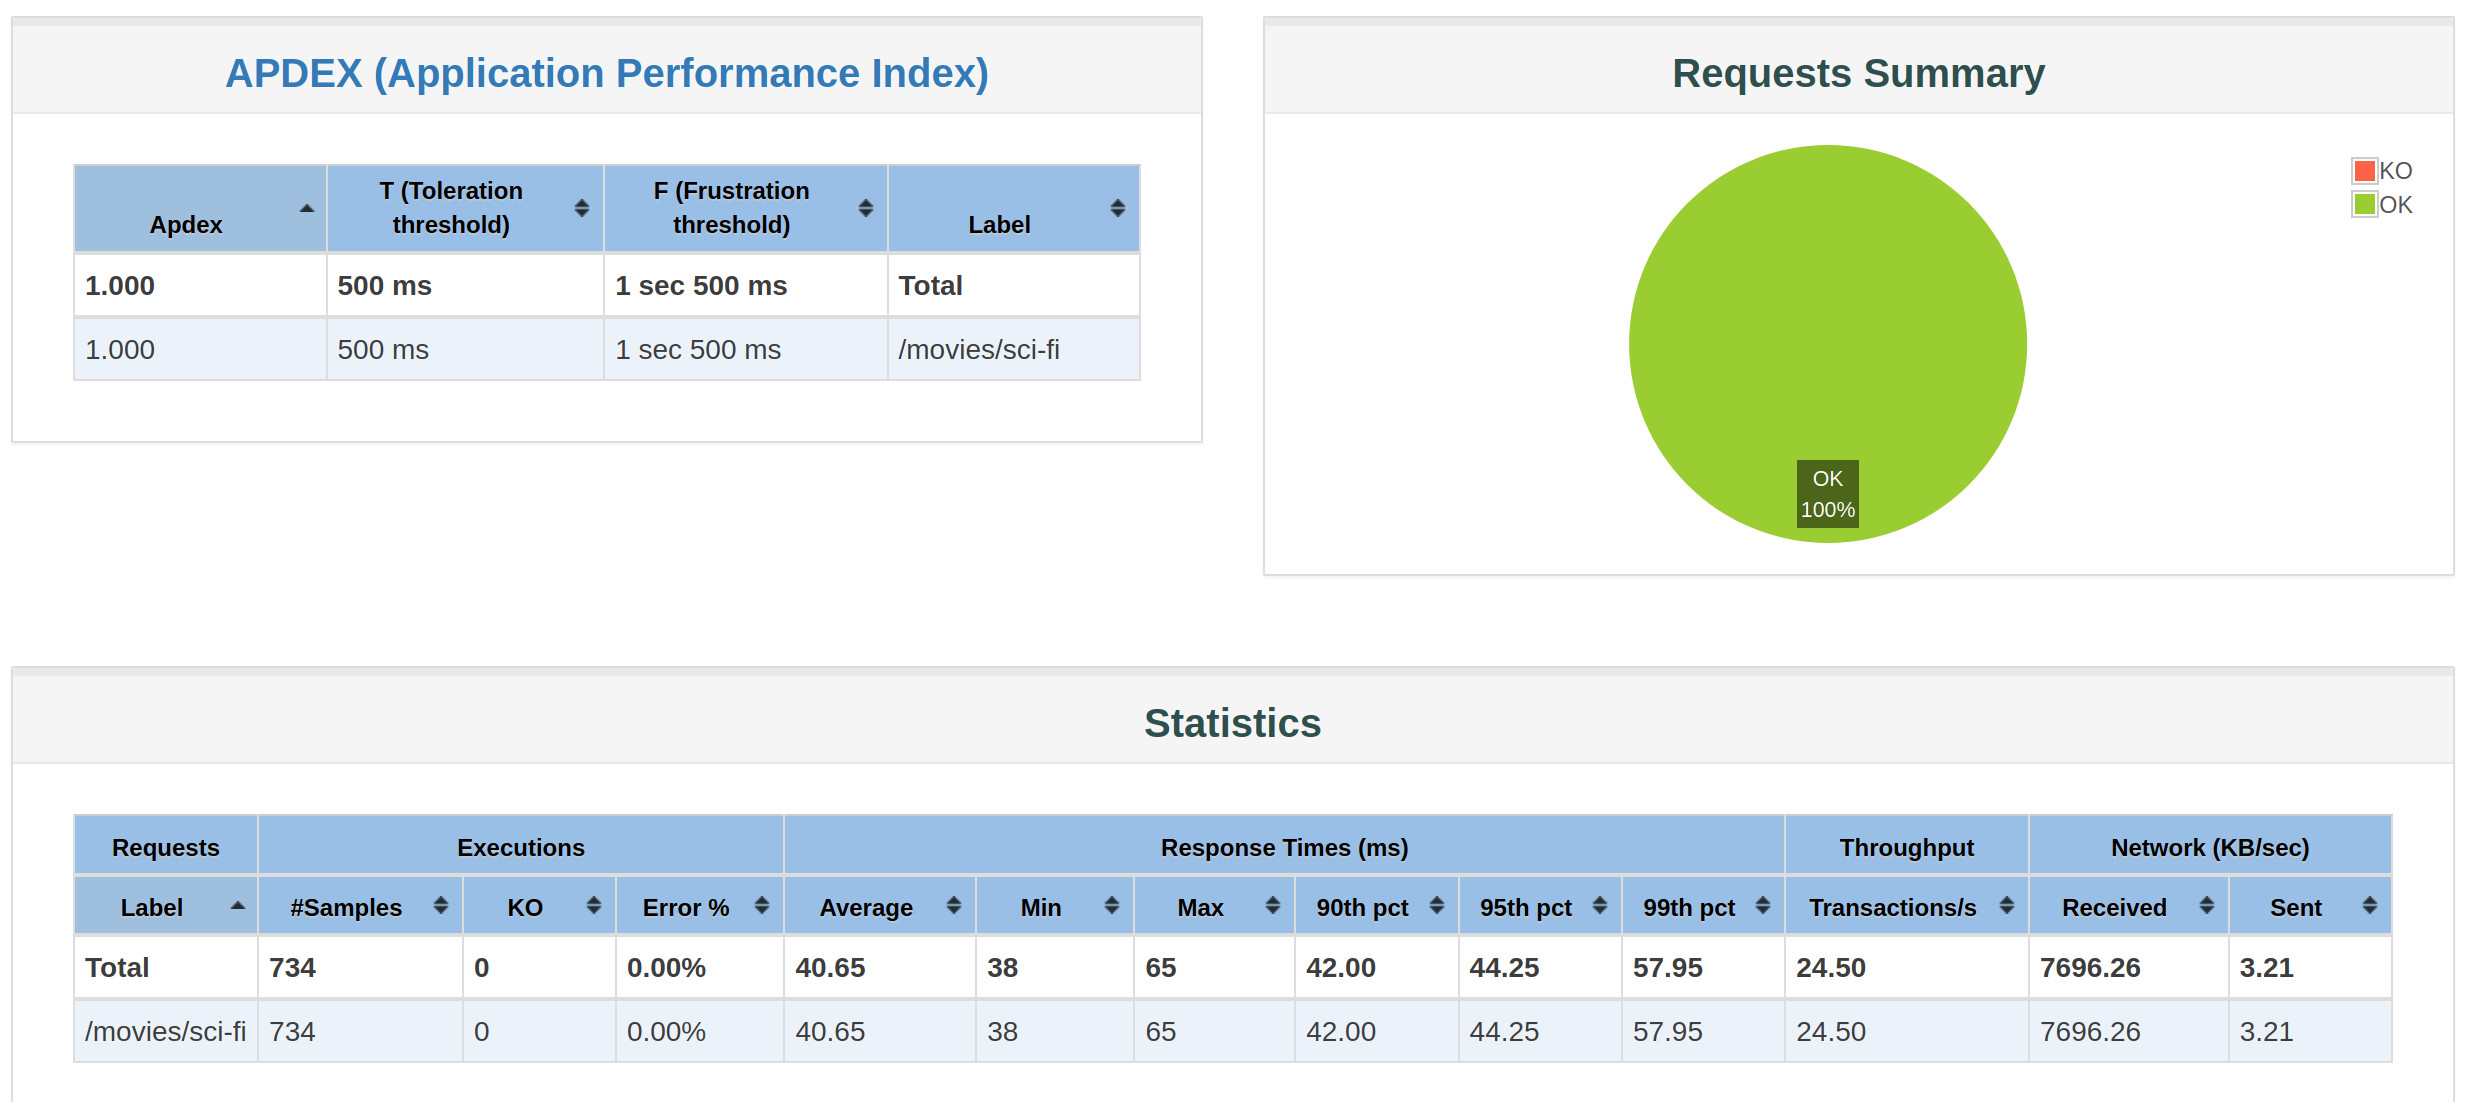
And this is the report that we get
Getting data from Grafana
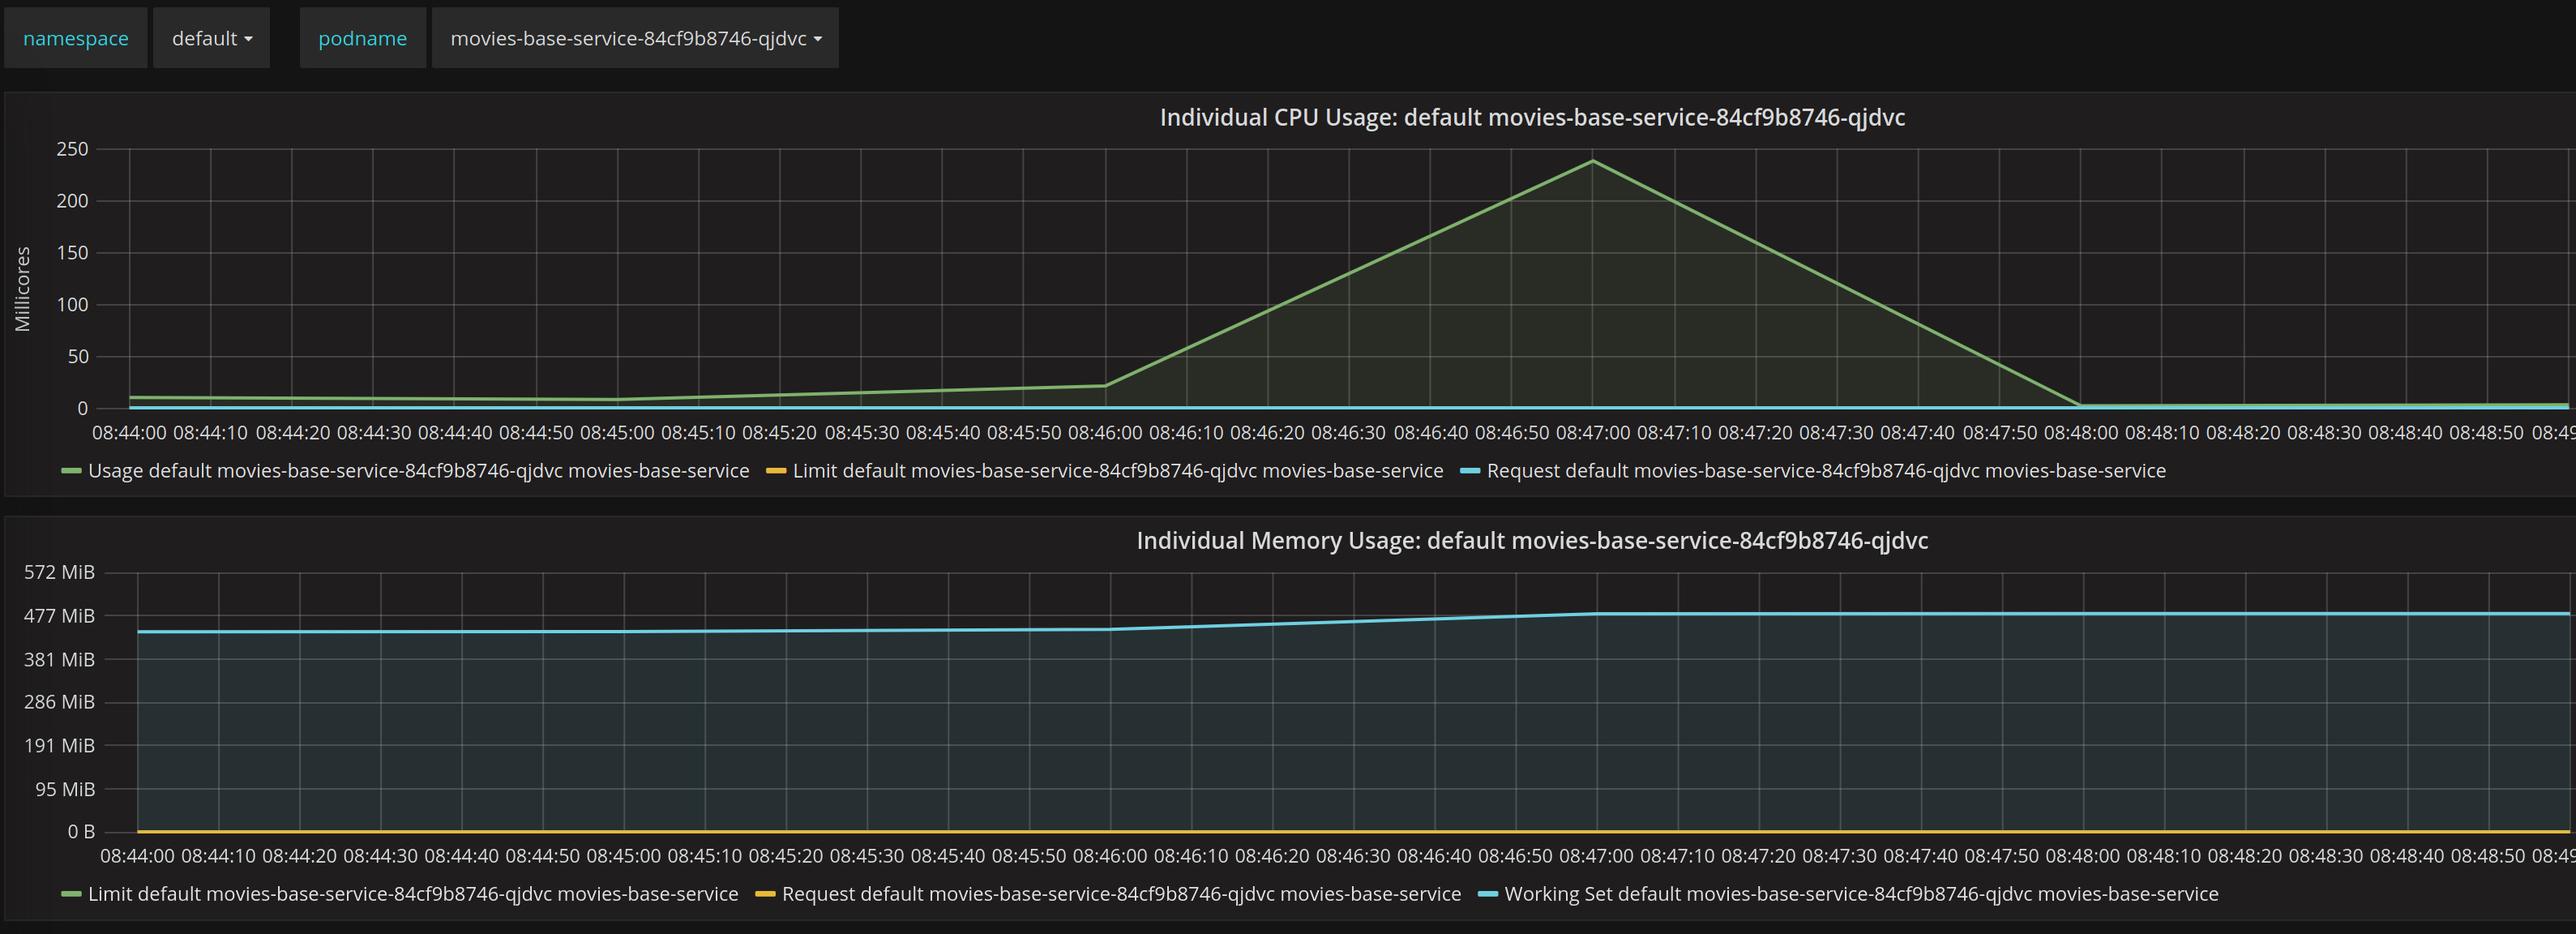
Now that we have done a simple test we could go to Grafana and look at the graph for this small test
We could see in this test that initial we have a small increase of CPU and them a peak, this was quite rapidly because our ramp up period was just one second, them we see a dropdown after our test.
In terms of memory we see how slightly increase and remain unmodified during the test.
Scaling
For the next test we will need to increase and decrease the replicas of our service, we will use an small script for this mater name scale.sh
#!/bin/sh -

set -o errexit

if [ $# -ne 2 ]; then
  echo "Illegal number of parameters, usage : "
  echo " "
  echo "  $0 <k8-deployment-name> <replicas>"
  echo " "
  echo " examples: "
  echo "  - $0 my-deployment 5"
  echo "  - $0 my-deployment 0"
  exit 2
fi

KUBECMD="kubectl"
if [ -x "$(command -v microk8s.kubectl)" ]; then
  KUBECMD="microk8s.kubectl"
fi

DEPLOYMENT_NAME="$1"
WANTED_REPLICAS="$2"
REPLICAS="0"
PREVIOUS_REPLICAS="-1"

replicas() {
  REPLICAS=$($KUBECMD get "deployment/$DEPLOYMENT_NAME" -o jsonpath='{.status.readyReplicas}')
  if test -z "$REPLICAS"; then
    REPLICAS="0"
  fi
}

echo "checking deployment: $DEPLOYMENT_NAME"

replicas
if [ "$REPLICAS" -eq "$WANTED_REPLICAS" ]; then
  echo "we dont need to scale allready got $REPLICAS replicas ready"
  exit 0
fi

echo "scaling deployment: $DEPLOYMENT_NAME to $WANTED_REPLICAS replicas"

$KUBECMD scale deployment/movies-base-service --replicas "$WANTED_REPLICAS"

START=$(date +%s.%N)

while true; do
  if [ "$REPLICAS" != "$PREVIOUS_REPLICAS" ]; then
    echo "waiting for scaling: got $REPLICAS replicas, want $WANTED_REPLICAS"
    PREVIOUS_REPLICAS="$REPLICAS"
  fi
  if [ "$REPLICAS" -eq "$WANTED_REPLICAS" ]; then
    END=$(date +%s.%N)
    DIFF=$(echo "$END - $START" | bc)
    echo "scaling complete, $REPLICAS ready, in $DIFF seconds"

    exit 0
  fi
  replicas
done
This script will tell K8s to scale our replica to a number and wait until we have the number of replicas that we ask for.
First let’s scale our application to 0 replicas.
$ ./scale.sh movies-base-service 0
checking deployment: movies-base-service
scaling deployment: movies-base-service to 0 replicas
deployment.apps/movies-base-service scaled
waiting for scaling: got 1 replicas, want 0
waiting for scaling: got 0 replicas, want 0
scaling complete, 0 ready, in .057501722 seconds
Not let’s scale our service to 5 replicas.
$ ./scale.sh movies-base-service 5
checking deployment: movies-base-service
scaling deployment: movies-base-service to 5 replicas
deployment.apps/movies-base-service scaled
waiting for scaling: got 0 replicas, want 5
waiting for scaling: got 1 replicas, want 5
waiting for scaling: got 2 replicas, want 5
waiting for scaling: got 3 replicas, want 5
waiting for scaling: got 4 replicas, want 5
waiting for scaling: got 5 replicas, want 5
scaling complete, 5 ready, in 15.111852160 seconds
And now we will repeat our test but with 10 concurrent users :
$ ./load-test.sh 10 30 1
deleting report directory
report directory deleted
creating report directory
report directory created
launching a load test on http://10.152.183.252:8080/movies/sci-fi with 10  user(s) during 30 seconds, ramping up during 1 seconds
Creating summariser <summary>
Created the tree successfully using /home/jamedina/src/movies-base-service/k8s-sv-load-test/load_test.jmx
Starting standalone test @ Sat Jan 11 09:36:12 GMT 2020 (1578735372194)
Waiting for possible Shutdown/StopTestNow/HeapDump/ThreadDump message on port 4445
Warning: Nashorn engine is planned to be removed from a future JDK release
summary +    486 in 00:00:18 =   27.5/s Avg:   347 Min:    44 Max:  1118 Err:     0 (0.00%) Active: 10 Started: 10 Finished: 0
summary +    327 in 00:00:13 =   25.1/s Avg:   401 Min:   108 Max:  1204 Err:     0 (0.00%) Active: 0 Started: 10 Finished: 10
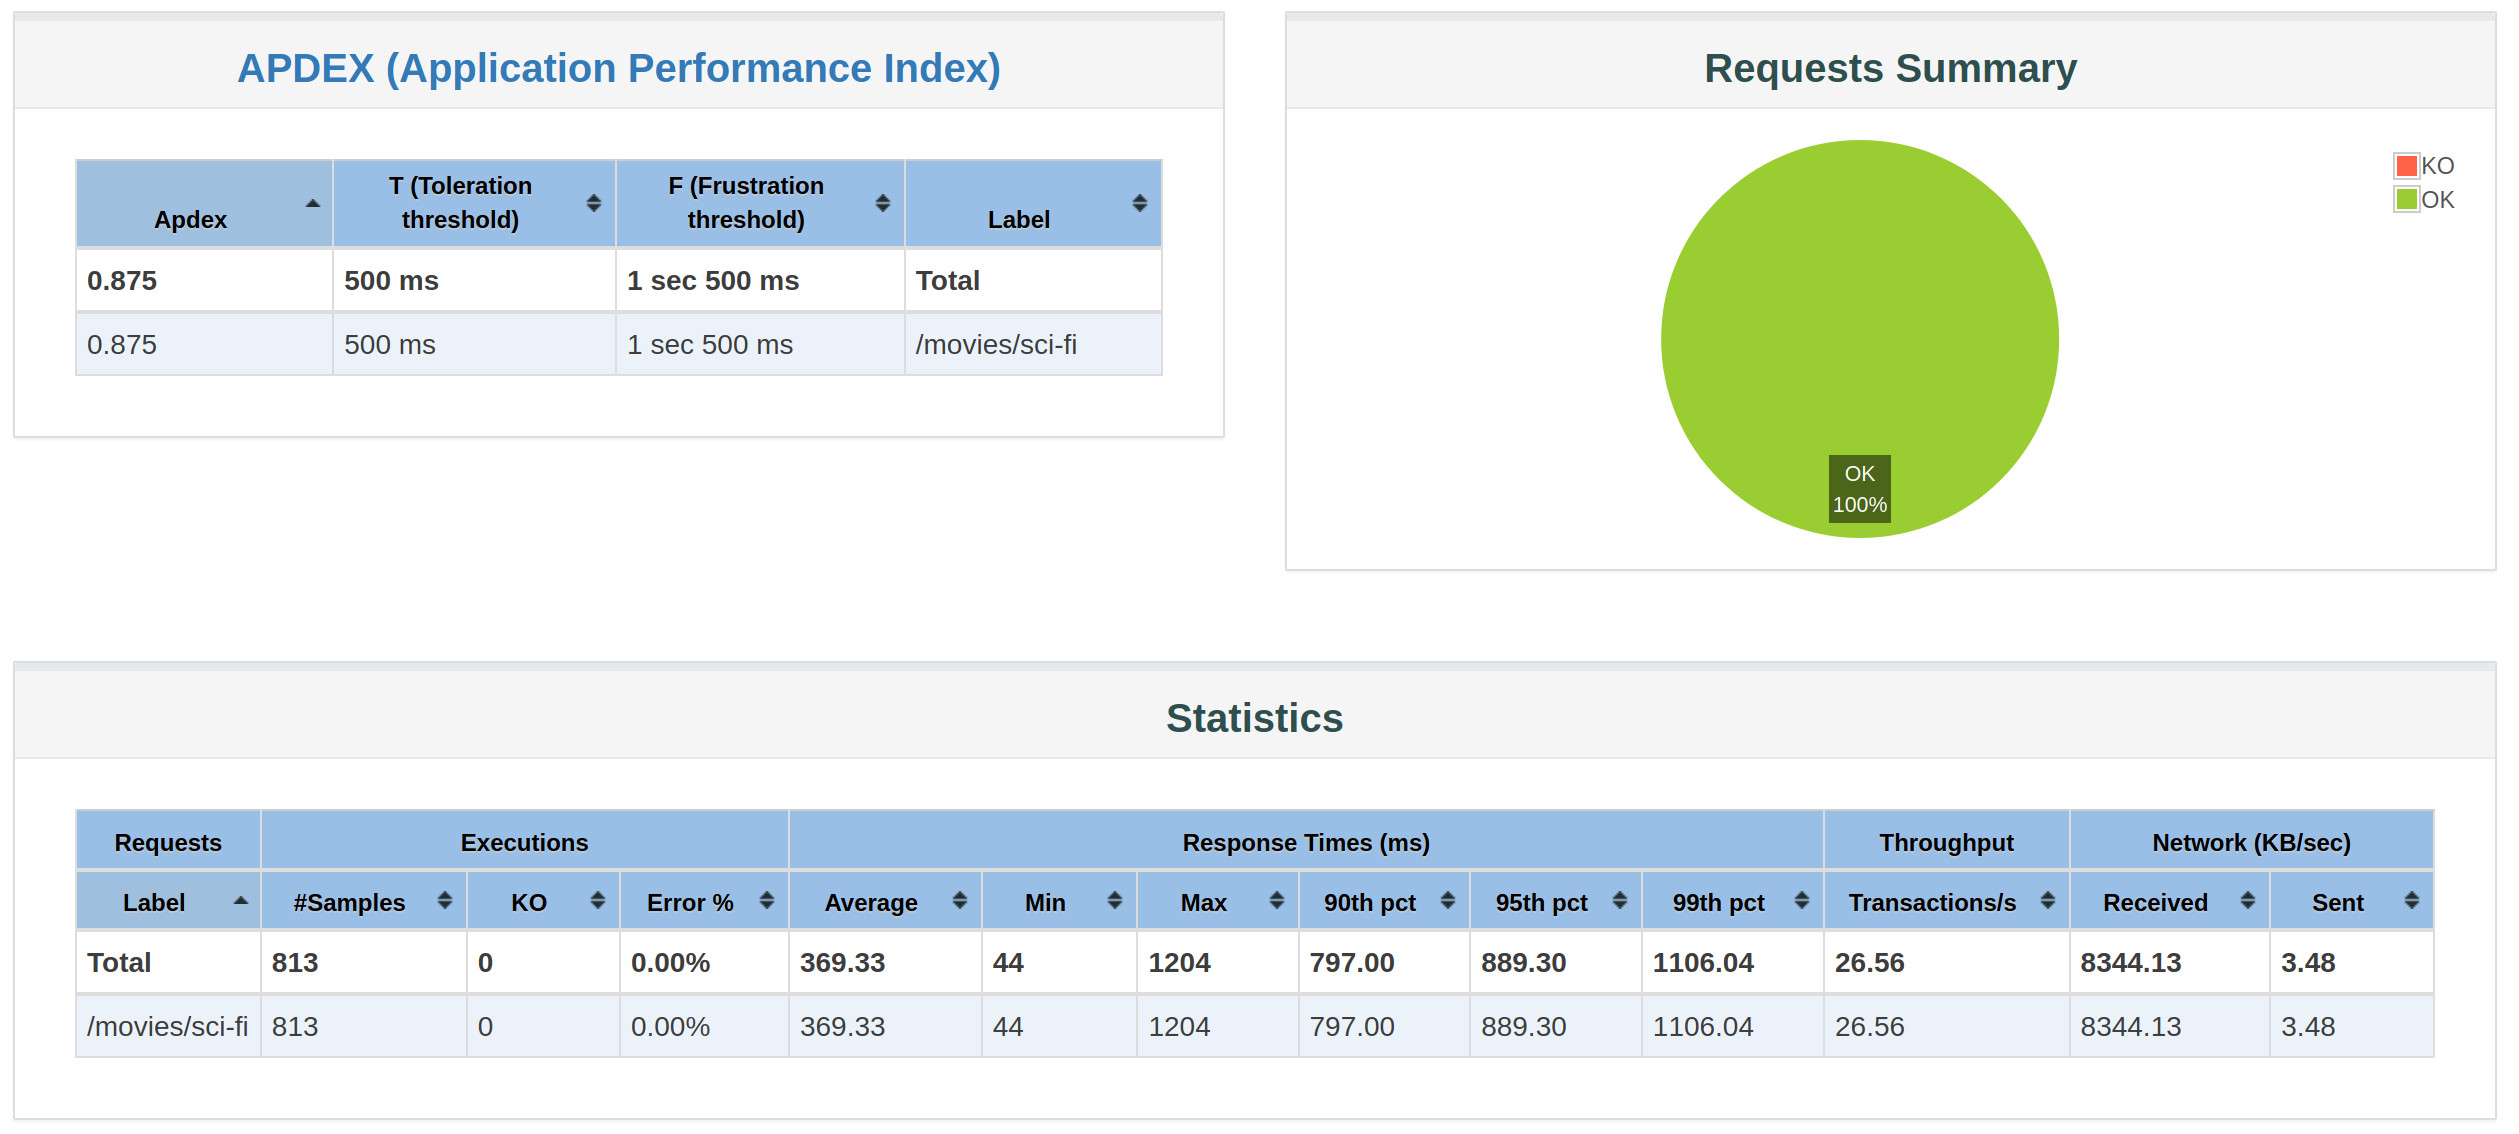
summary =    813 in 00:00:31 =   26.5/s Avg:   369 Min:    44 Max:  1204 Err:     0 (0.00%)
Tidying up ...    @ Sat Jan 11 09:36:43 GMT 2020 (1578735403018)
... end of run
load test done
report available on file:////home/jamedina/src/movies-base-service/k8s-sv-load-test/report/index.html
And this is the report that we got :
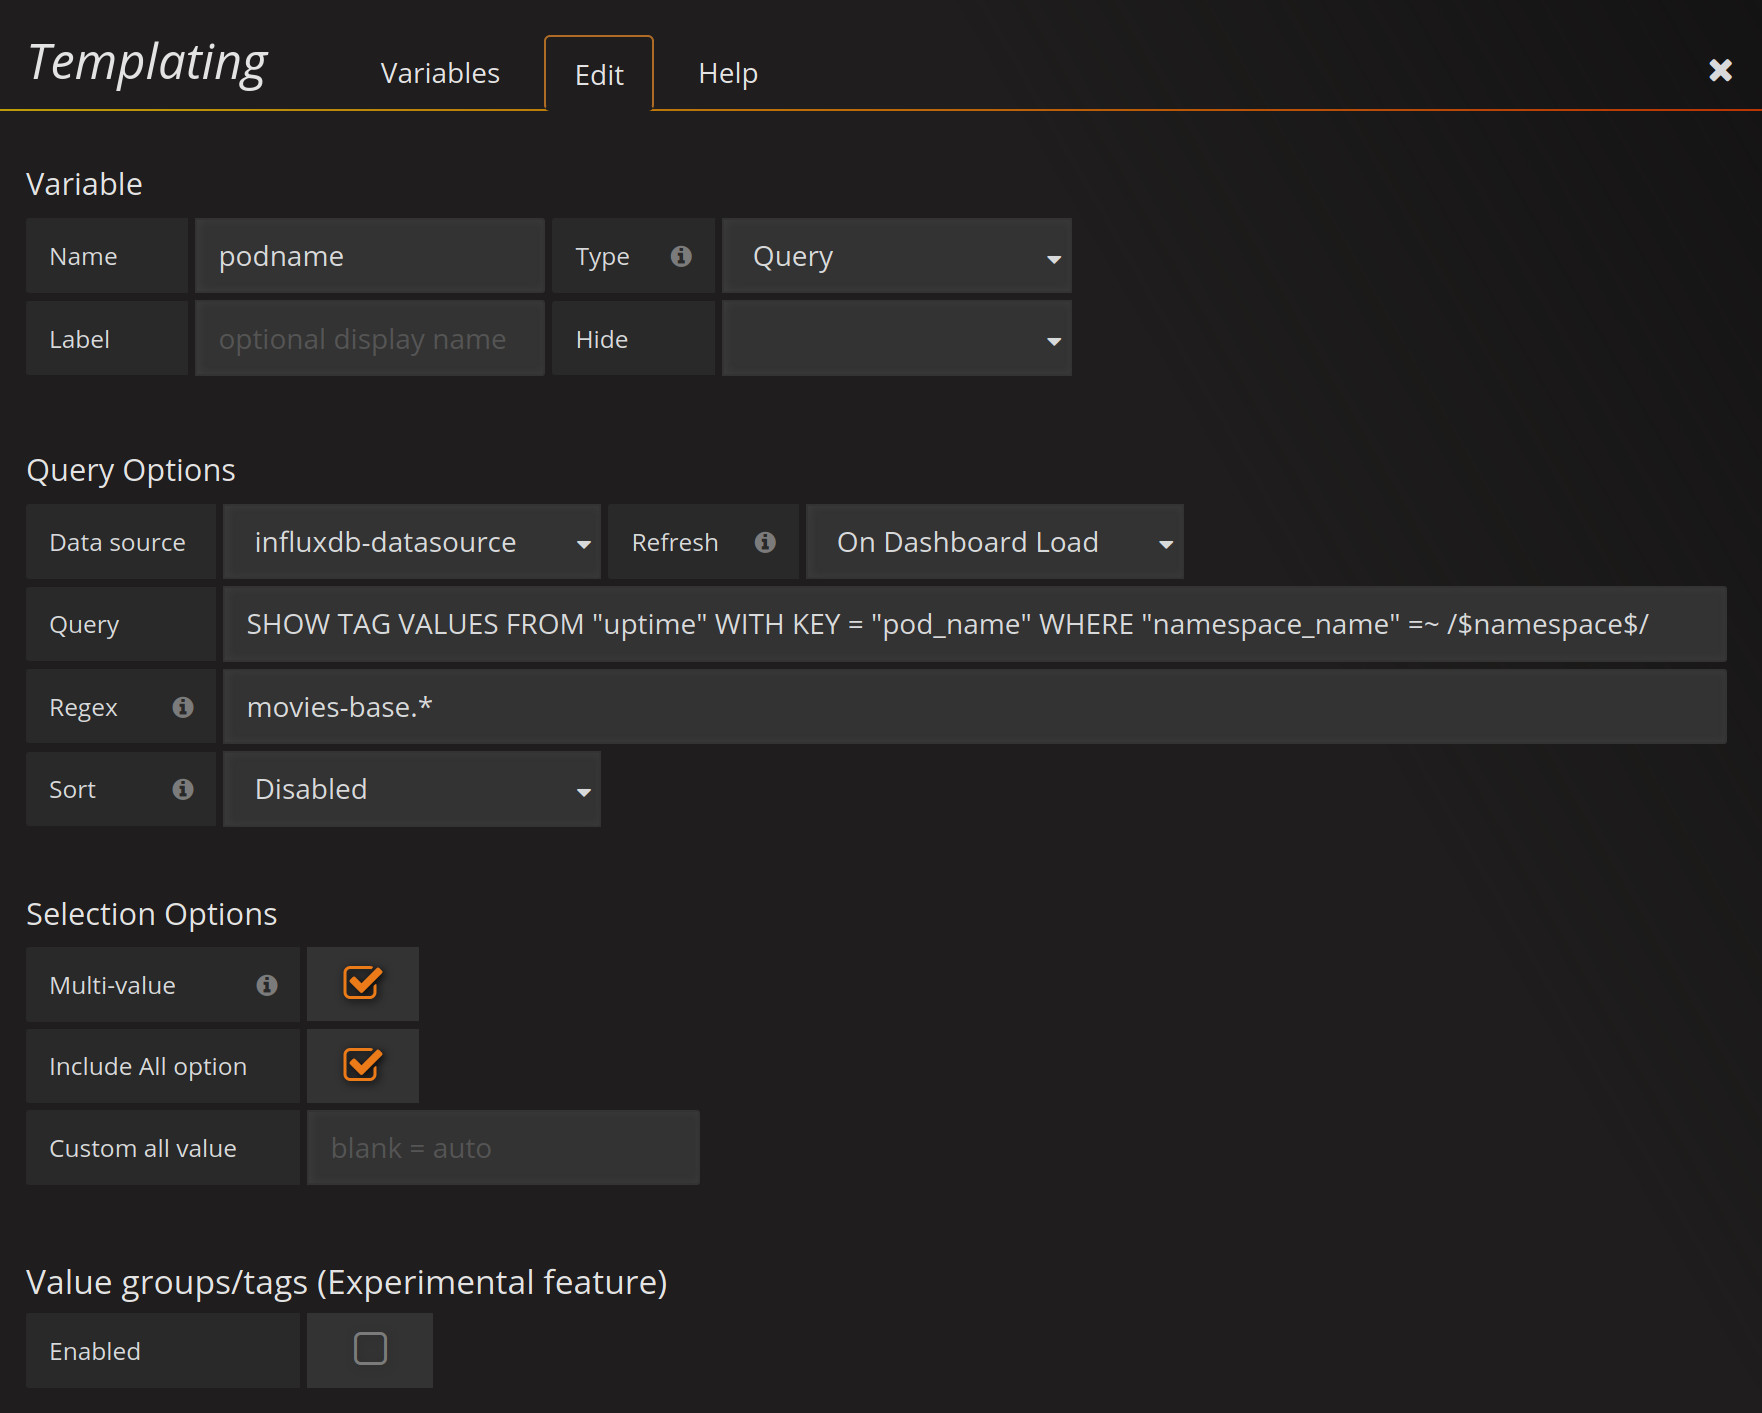
We like to get now the data from Grafana but we will create a copy of the Pods dashboard and name “movies” then we will edit the template to get our al movies pods :
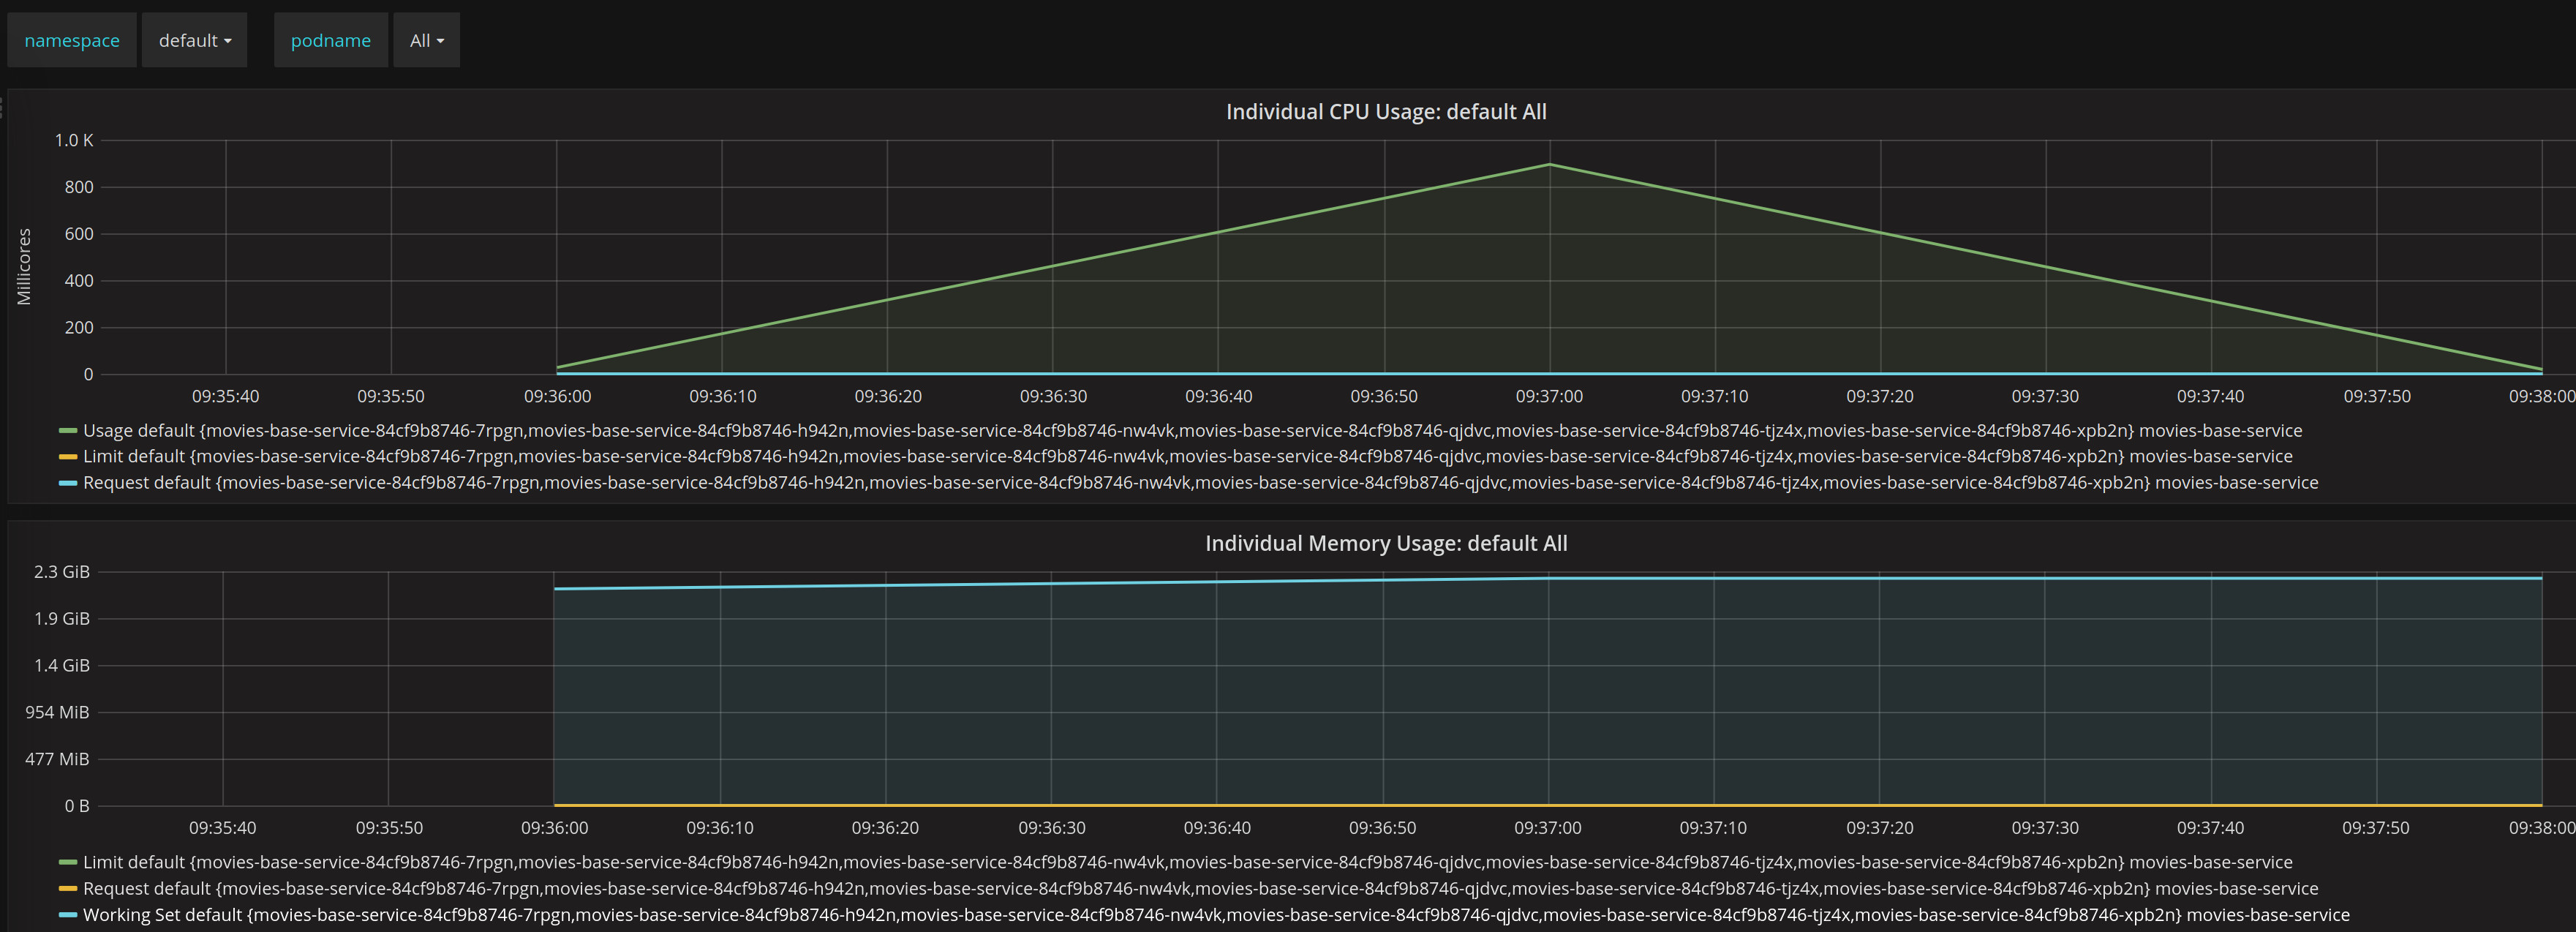
Finally we will get from Grafana the graph for our 5 pods 10 users test :
Getting our measure
Now that we have this tools ready we will defined how we are going to measure this base service, and hopefuly futher services on the nexst parts for the series. We know that we have dozen of different metrics to get from our tools but we are going some very simple with just few data points, and we are not focus on a particular runtime, so they will be not JVM metrics, because we will not haven in all the parts of this series.
We will do this procedure with 1, 10, 25 and 50 concurrent users and 1 replica :
- Scale the replicas to 0
- Stop our cluster
- Start our cluster
- Scale to desired number replicas
- Run the test for the desire set of concurrent users during 10 minutes with a ramp up of 1 minute
- If all request are OK (HTTP response code is 200) :
- Get from the JMeter report :
- Average response time
- Transactions per second
- Get from Grafana
- Max CPU Usage
- Max Memory Usage
- Get from the JMeter report :
- If some request are not OK (HTTP response code is not 200)
- We will increase the desire number of replicas to one more
Then we will repeat this procedure until we got the results for 100 concurrent users.
We will scale down our replicas and restart our cluster to guarantee that each test is a fresh run, including the database load and connections.
The Results
This are the results for this first example in the series, if you repeat the steps you may get different numbers because they depend on the cluster and the computer that is launching the tests.
| C. Users | Pods | ART | TPS | Max CPU | Max MEM |
|---|---|---|---|---|---|
| 1 | 1 | 39.16 | 25.49 | 403 | 474 |
| 10 | 1 | 570.47 | 16.73 | 916 | 487 |
| 25 | 3 | 1615.82 | 14.72 | 1049 | 1454 |
| 50 | 5 | 3190.98 | 14.89 | 1351 | 2499 |
Java 8 - Spring Boot 2.0 - Spring Web - Spring Data JDBC default settings, unoptimized
With this will close this first article, next we will try to optimize this first service and compare the results with the base.
Note: The full code of this service is available at this repository.
Resources
- https://docs.spring.io/spring-data/jdbc/docs/current/reference/html/#jdbc.query-methods
- https://www.baeldung.com/spring-jdbc-jdbctemplate
- https://hub.docker.com/_/openjdk
- https://spring.io/guides/gs/spring-boot-docker/
- https://spring.io/guides/gs/spring-boot-kubernetes/
- https://www.baeldung.com/spring-boot-kubernetes-self-healing-apps
- http://jmeter.apache.org/usermanual/hints_and_tips.html#hidpi
- https://jmeter.apache.org/usermanual/best-practices.html
