Kubernetes (K8s) has become the defacto standard for containers orchestration, and since I like to do some more example about it I was needed to setup it on my system.
In the past I’ve use minikube for running a local installation of k8s on my environment but since I recently switched to Linux Mint for most of my development I decided to to use MicroK8s.
MicroK8s is a small, fast and very simple to install, even for clustering, k8s in a single package, created by Canonical the company behind Ubuntu.
One the benefits for using Microk8s on Linux is that its run natively (without virtualization), and since Mint is base on Ubuntu this installation is even easer. On Windows and Mac you will need to use Micropass to run a virtual machine with Ubuntu first.
Minikube uses virtualization in all of the OS that runs, even in linux, and for this is more resource intensive, however is developed by the same team that develop k8s, regardless both are CNF certified k8s solutions. MicroK8s tracks upstream releases of k8s to keep itself up to date with k8s development.
Installing Snap
We will install microk8s using an Snap.
Snaps are linux app packages for desktop, cloud and IoT that are easy to install, secure and cross-platform, they are self-contained, including dependencies, and they could be uninstalled without affecting the rest of your system.
From Ubuntu 14.04 LTS onwards snap is already installed, for previous versions we need to install it with apt :
$ sudo apt update
$ sudo apt install snapd
After installed we could just check the version that we have using :
$ snap version
snap       2.42.1+18.04
snapd      2.42.1+18.04
series     16
linuxmint  19.2
kernel     4.15.0-72-generic
Installing MicroK8s
Now that we have snap we could install MicroK8s just doing :
$ sudo snap install microk8s --classic
microk8s v1.16.3 from Canonical✓ installed
In order tu use MicroK8s we need either to use sudo or add our username to the microk8s group:
$ sudo usermod -a -G microk8s usernameAfter login in back again we could not check the status of our k8s cluster with :
$ microk8s.status
microk8s is running
If we want to stop or start our cluster we could do it using microk8s.stop or microk8s.start whenever we need.
MicroK8s provide several commands to manage our cluster, but embed within the installation for example if we want to see what is running in our cluster using kubectl we need to do:
$ microk8s.kubectl get all --all-namespaces
NAMESPACE   NAME                 TYPE        CLUSTER-IP     EXTERNAL-IP   PORT(S)   AGE
default     service/kubernetes   ClusterIP   10.152.183.1   <none>        443/TCP   17m
Adding addons
Microk8s installation is very minimal if we like to have a dashboard we need to enable as an addon, they are several of them so we will enable some basics ones :
$ microk8s.enable dashboard dns registry fluentdUsing the dashboard
For using the dashboard we need first to find the IP address in our cluster, for this we could just do :
$ microk8s.kubectl get service kubernetes-dashboard -n kube-system

NAME                   TYPE        CLUSTER-IP      EXTERNAL-IP   PORT(S)   AGE
kubernetes-dashboard   ClusterIP   10.152.183.75   <none>        443/TCP   28m
No we know that our dashboard is running at https://10.152.183.75, however we need a access token for using it, we could get the token with the following commands:
Get from secrets the default-token secret name:
$ microk8s.kubectl get secret -n kube-system | grep default-token
default-token-gkjsl                              kubernetes.io/service-account-token
Get the token, that is the value for the secret name:
$ microk8s.kubectl describe secret default-token-gkjsl -n kube-system Now with this token we can logon into our dashboard:
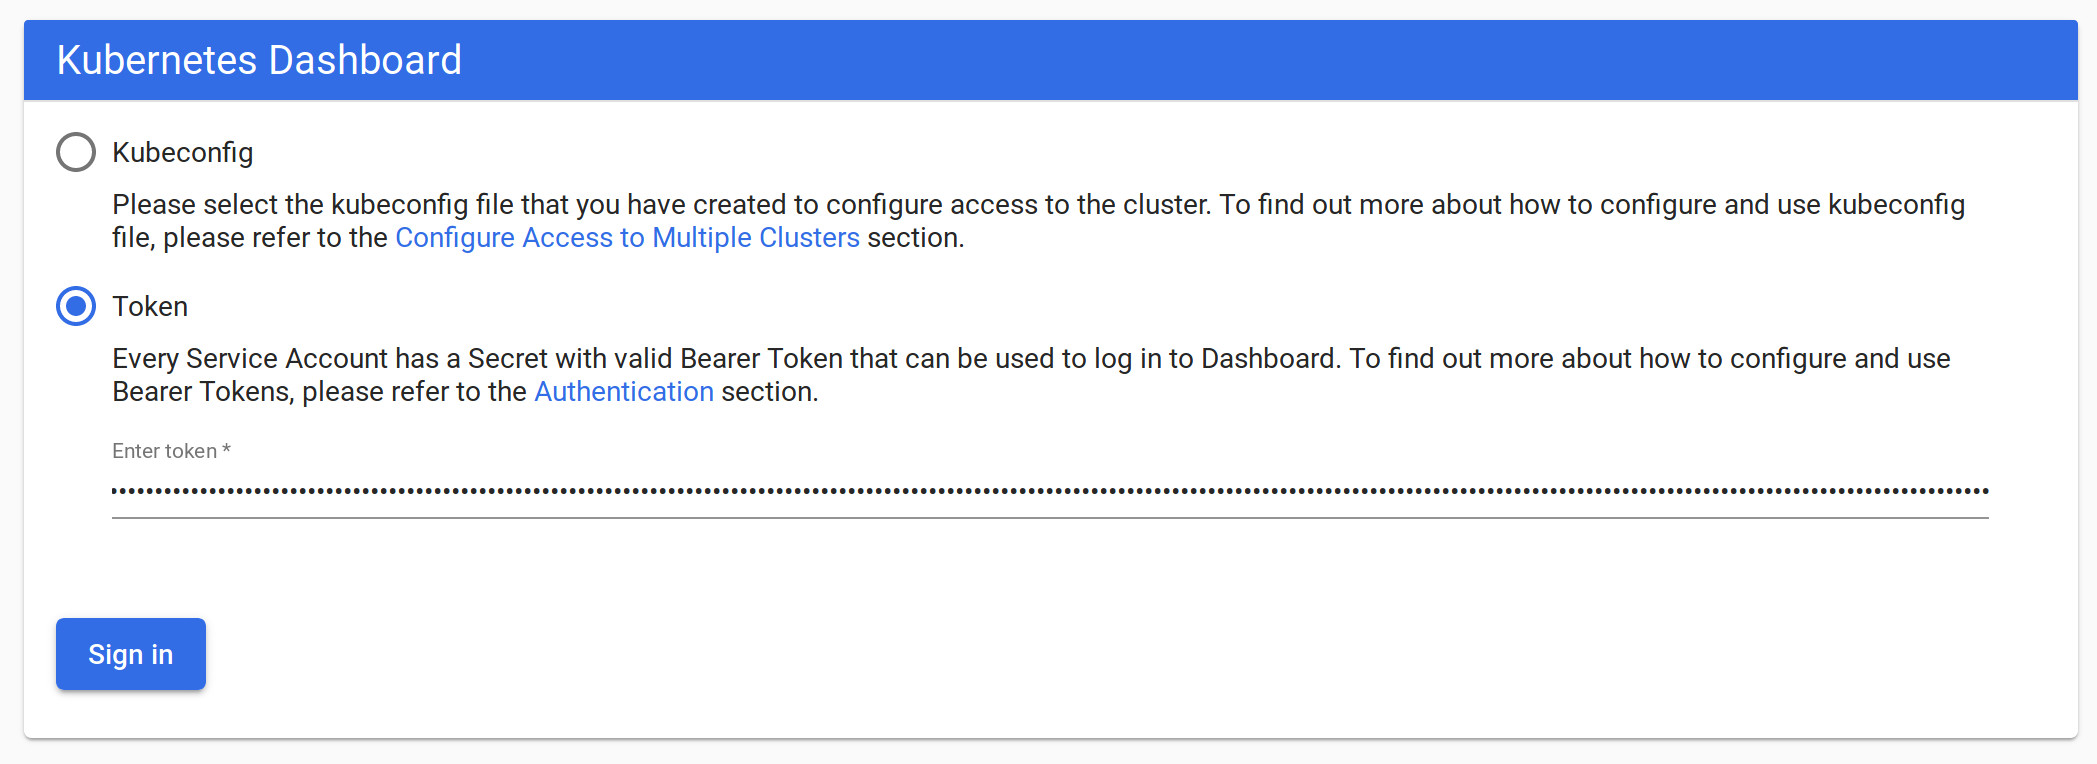
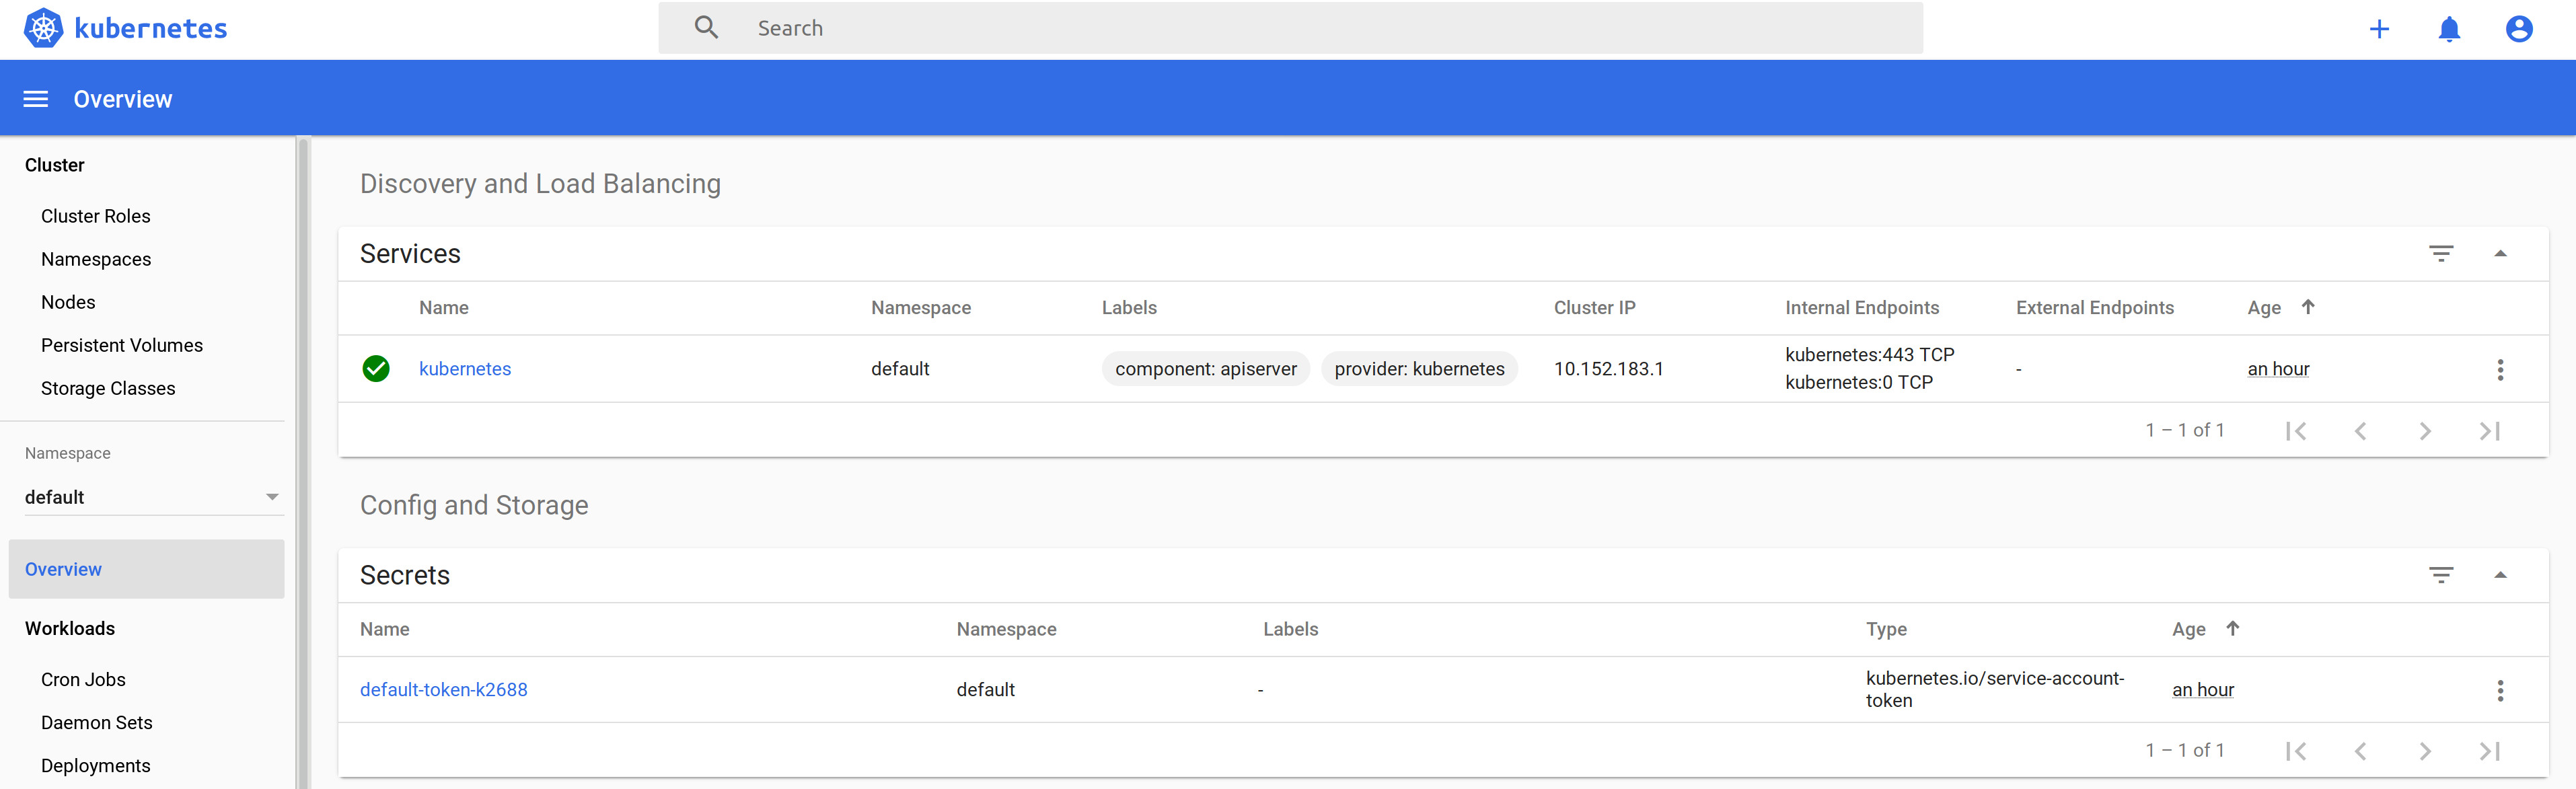
We will choose to use a token and we will use the one that we just get, and finally we will see our dashboard:
Adding a demo application
For configuring further our MicroK8s we will deploy a new application with two replicas:
$ microk8s.kubectl create deployment microbot --image=dontrebootme/microbot:v1
deployment.apps/microbot created
$ microk8s.kubectl scale deployment microbot --replicas=2
Now we could check that we have actually two pods runing with :
$ microk8s.kubectl get pod --selector=app=microbot
NAME                        READY   STATUS    RESTARTS   AGE
microbot-5bb7fd7f5d-dshtf   1/1     Running   0          2m30s
microbot-5bb7fd7f5d-mdcvs   1/1     Running   0          3m30s
To access to our applicacion we will expose it trough a NodePort :
$ microk8s.kubectl expose deployment microbot --type=NodePort --port=80 \
    --name=microbot-service
service/microbot-service exposed
We could check our services with :
$ microk8s.kubectl get service --selector=app=microbot
NAME               TYPE       CLUSTER-IP       EXTERNAL-IP   PORT(S)        AGE
microbot-service   NodePort   10.152.183.136   <none>        80:31771/TCP   2m27s
And since is a NodePort we could use with the IP of our local machine at http://localhost :
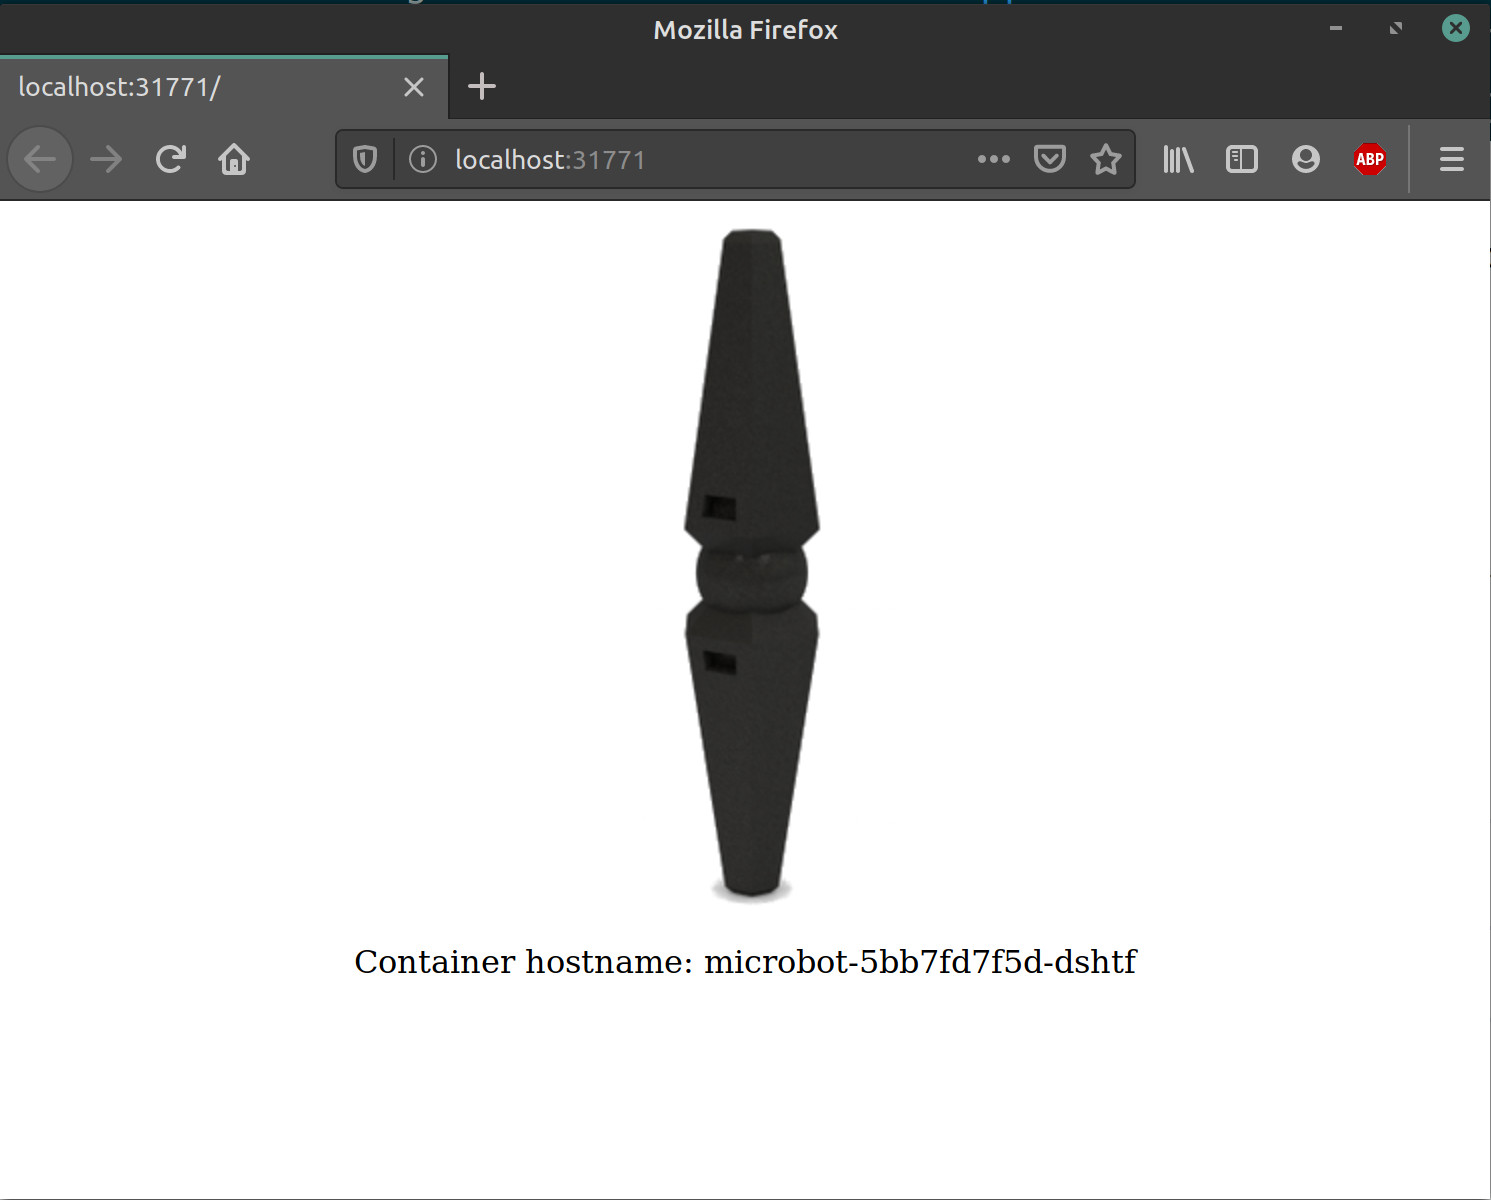
If we refresh the page invalidating cache, shift+ctrl+r on Firefox, we will get different containers for this application.
Configuring Kibana
Since we original add the addon fluentd we have a Elasticsearch + Kibana for our pods logs, but we need the URL Kibana, listing the cluster info will display urls for the addons that we have installed:
$ microk8s.kubectl cluster-info

Kubernetes master is running at https://127.0.0.1:16443
Elasticsearch is running at https://127.0.0.1:16443/api/v1/namespaces/kube-system/services/elasticsearch-logging/proxy
Heapster is running at https://127.0.0.1:16443/api/v1/namespaces/kube-system/services/heapster/proxy
Kibana is running at https://127.0.0.1:16443/api/v1/namespaces/kube-system/services/kibana-logging/proxy
CoreDNS is running at https://127.0.0.1:16443/api/v1/namespaces/kube-system/services/kube-dns:dns/proxy
Grafana is running at https://127.0.0.1:16443/api/v1/namespaces/kube-system/services/monitoring-grafana/proxy
InfluxDB is running at https://127.0.0.1:16443/api/v1/namespaces/kube-system/services/monitoring-influxdb:http/proxy
However before accessing we need the user and password for managing this cluster this could obtain with the command
$ microk8s.kubectl config view
apiVersion: v1
clusters:
- cluster:
    certificate-authority-data: DATA+OMITTED
    server: https://127.0.0.1:16443
  name: microk8s-cluster
contexts:
- context:
    cluster: microk8s-cluster
    user: admin
  name: microk8s
current-context: microk8s
kind: Config
preferences: {}
users:
- name: admin
  user:
    password: aRZbT45aNLB3AYUaz2rVa2RtzACoUR3zOGZoeWQ4c016SjlJSUt6bXNlRT0K
    username: admin
Now we could visit our Kibana in the url https://127.0.0.1:16443/api/v1/namespaces/kube-system/services/kibana-logging/proxy and use our admin user and password.
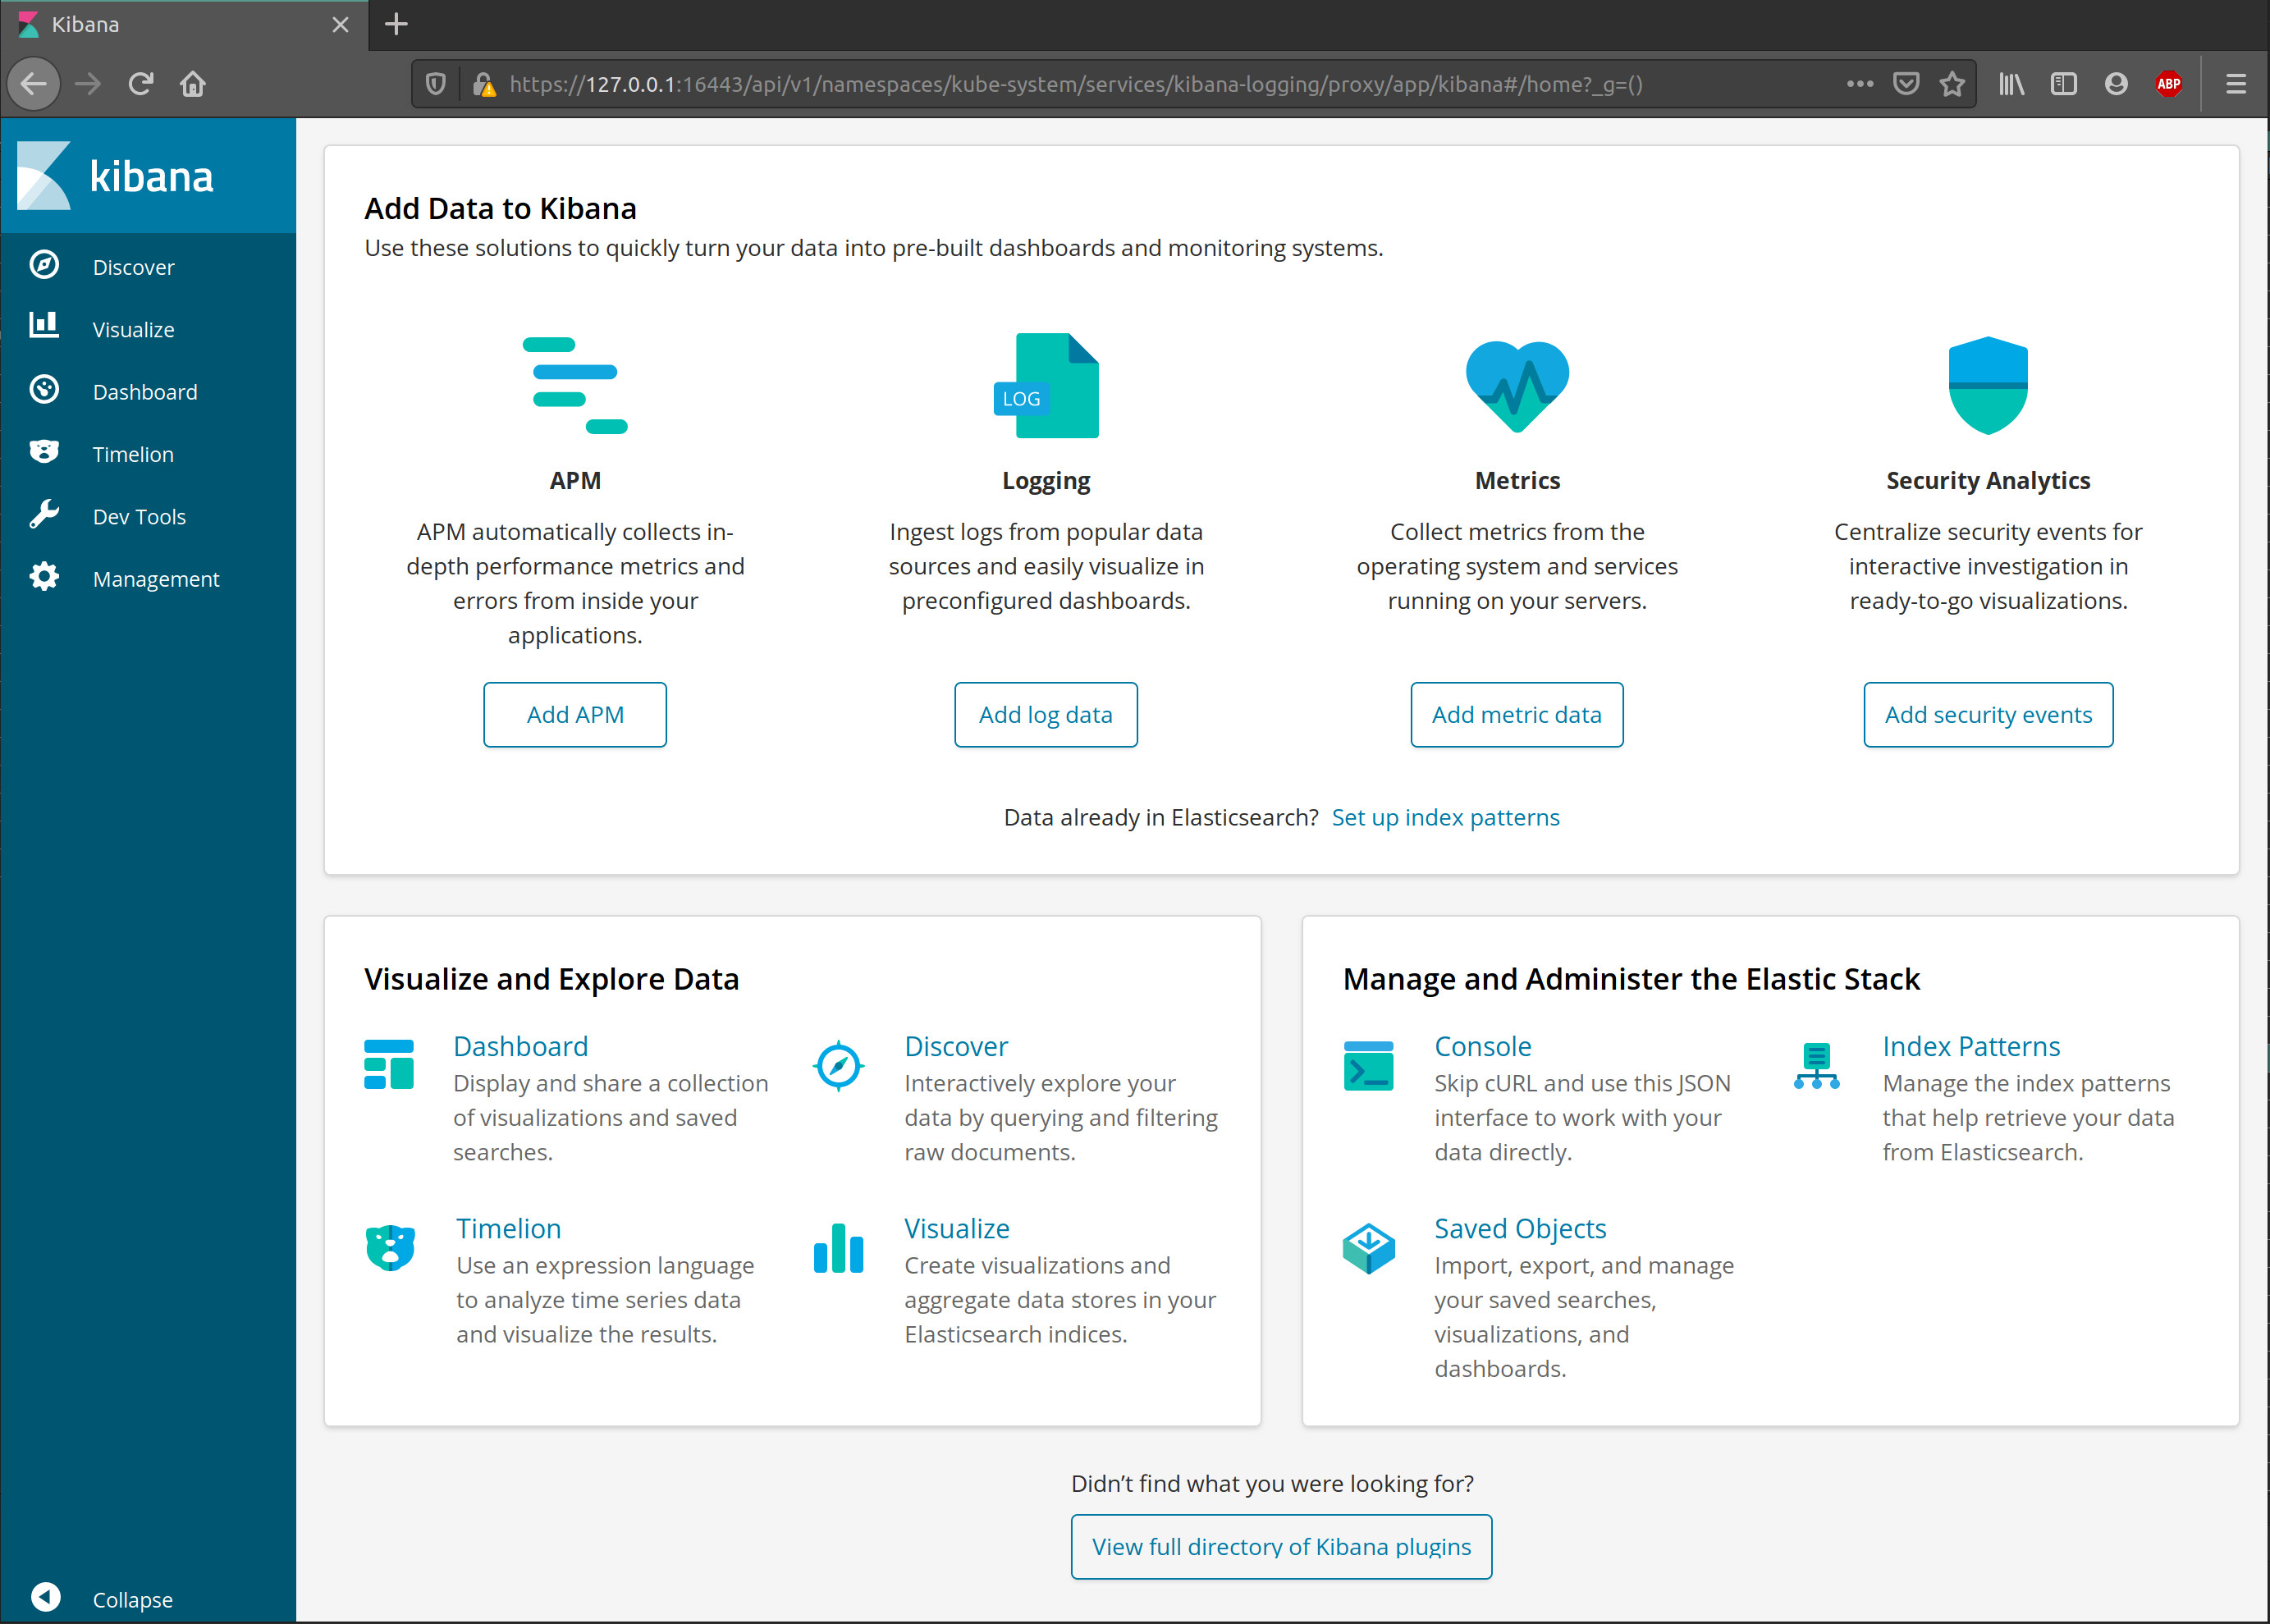
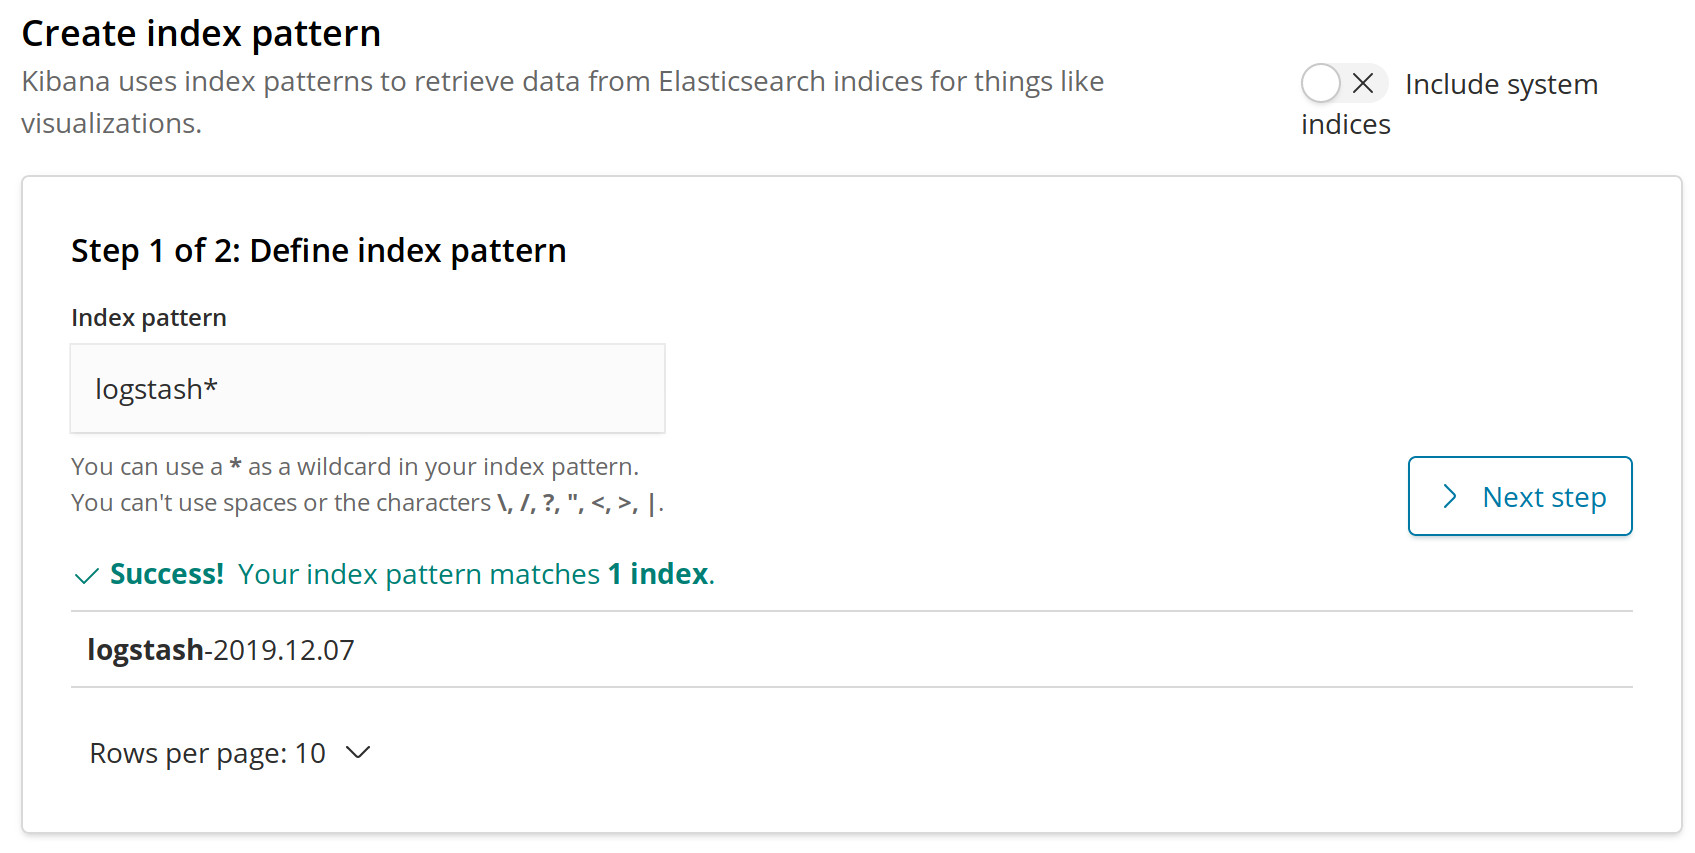
However if we like to browse the data when clicking on Discover we will get redirect to create an index, the pattern will be logstash*:
And finally we will set our Time Filter field name to be @timestamp:
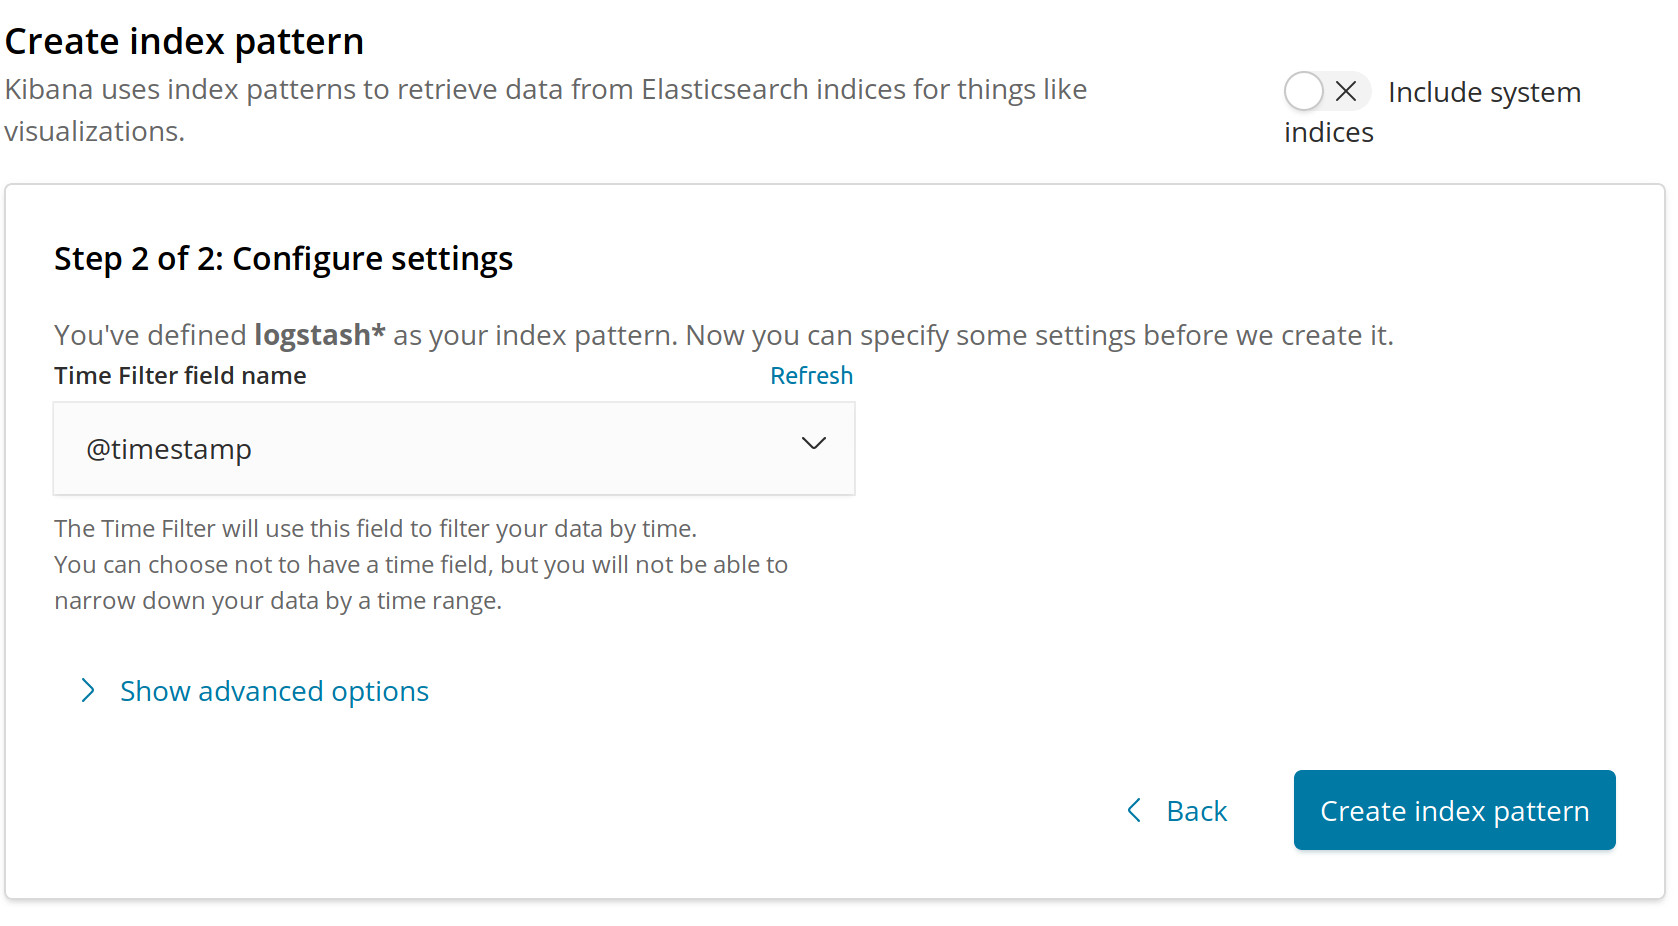
Now we could click on Create index pattern to complete our index creation.
For testing our index lets deploy another service to our cluster, one application that output on the logs random name into the stdout :
$ microk8s.kubectl create deployment random-generator --image=chriscmsoft/random-generator:latest
deployment.apps/random-generator created
$ microk8s.kubectl scale deployment random-generator --replicas=2
$ microk8s.kubectl get all --selector=app=random-generator
NAME                                    READY   STATUS    RESTARTS   AGE
pod/random-generator-7b6c47d877-plbsg   1/1     Running   0          54s
pod/random-generator-7b6c47d877-wh4jj   1/1     Running   0          11s

NAME                               READY   UP-TO-DATE   AVAILABLE   AGE
deployment.apps/random-generator   2/2     2            2           54s

NAME                                          DESIRED   CURRENT   READY   AGE
replicaset.apps/random-generator-7b6c47d877   2         2         2       54
We could check the log of this service with :
$ microk8s.kubectl logs --selector=app=random-generator
{"name": "Gara, The Magnificent"}
{"name": "Gairvol, The Puny"}
{"name": "Zyvrieliar, The Swift"}
{"name": "Gara, The Magnificent"}
{"name": "Xaymmynth, Champion Of The Blue"}
{"name": "Chynnyrth, Champion Of Men"}
{"name": "Xaerlulth, The Warm"}
{"name": "Xarsot, The Tyrant"}
{"name": "Xaerlulth, The Warm"}
{"name": "Xaerlulth, The Warm"}
{"name": "Siovaeloi, Protector Of The Weak"}
{"name": "Siovaeloi, Protector Of The Weak"}
{"name": "Zaellyt, The Gifted One"}
{"name": "Gorsolun, Warmheart"}
{"name": "Vugeo, The Youngling"}
{"name": "Vugeo, The Youngling"}
{"name": "Xughus, The Tall"}
{"name": "Xaerlulth, The Warm"}
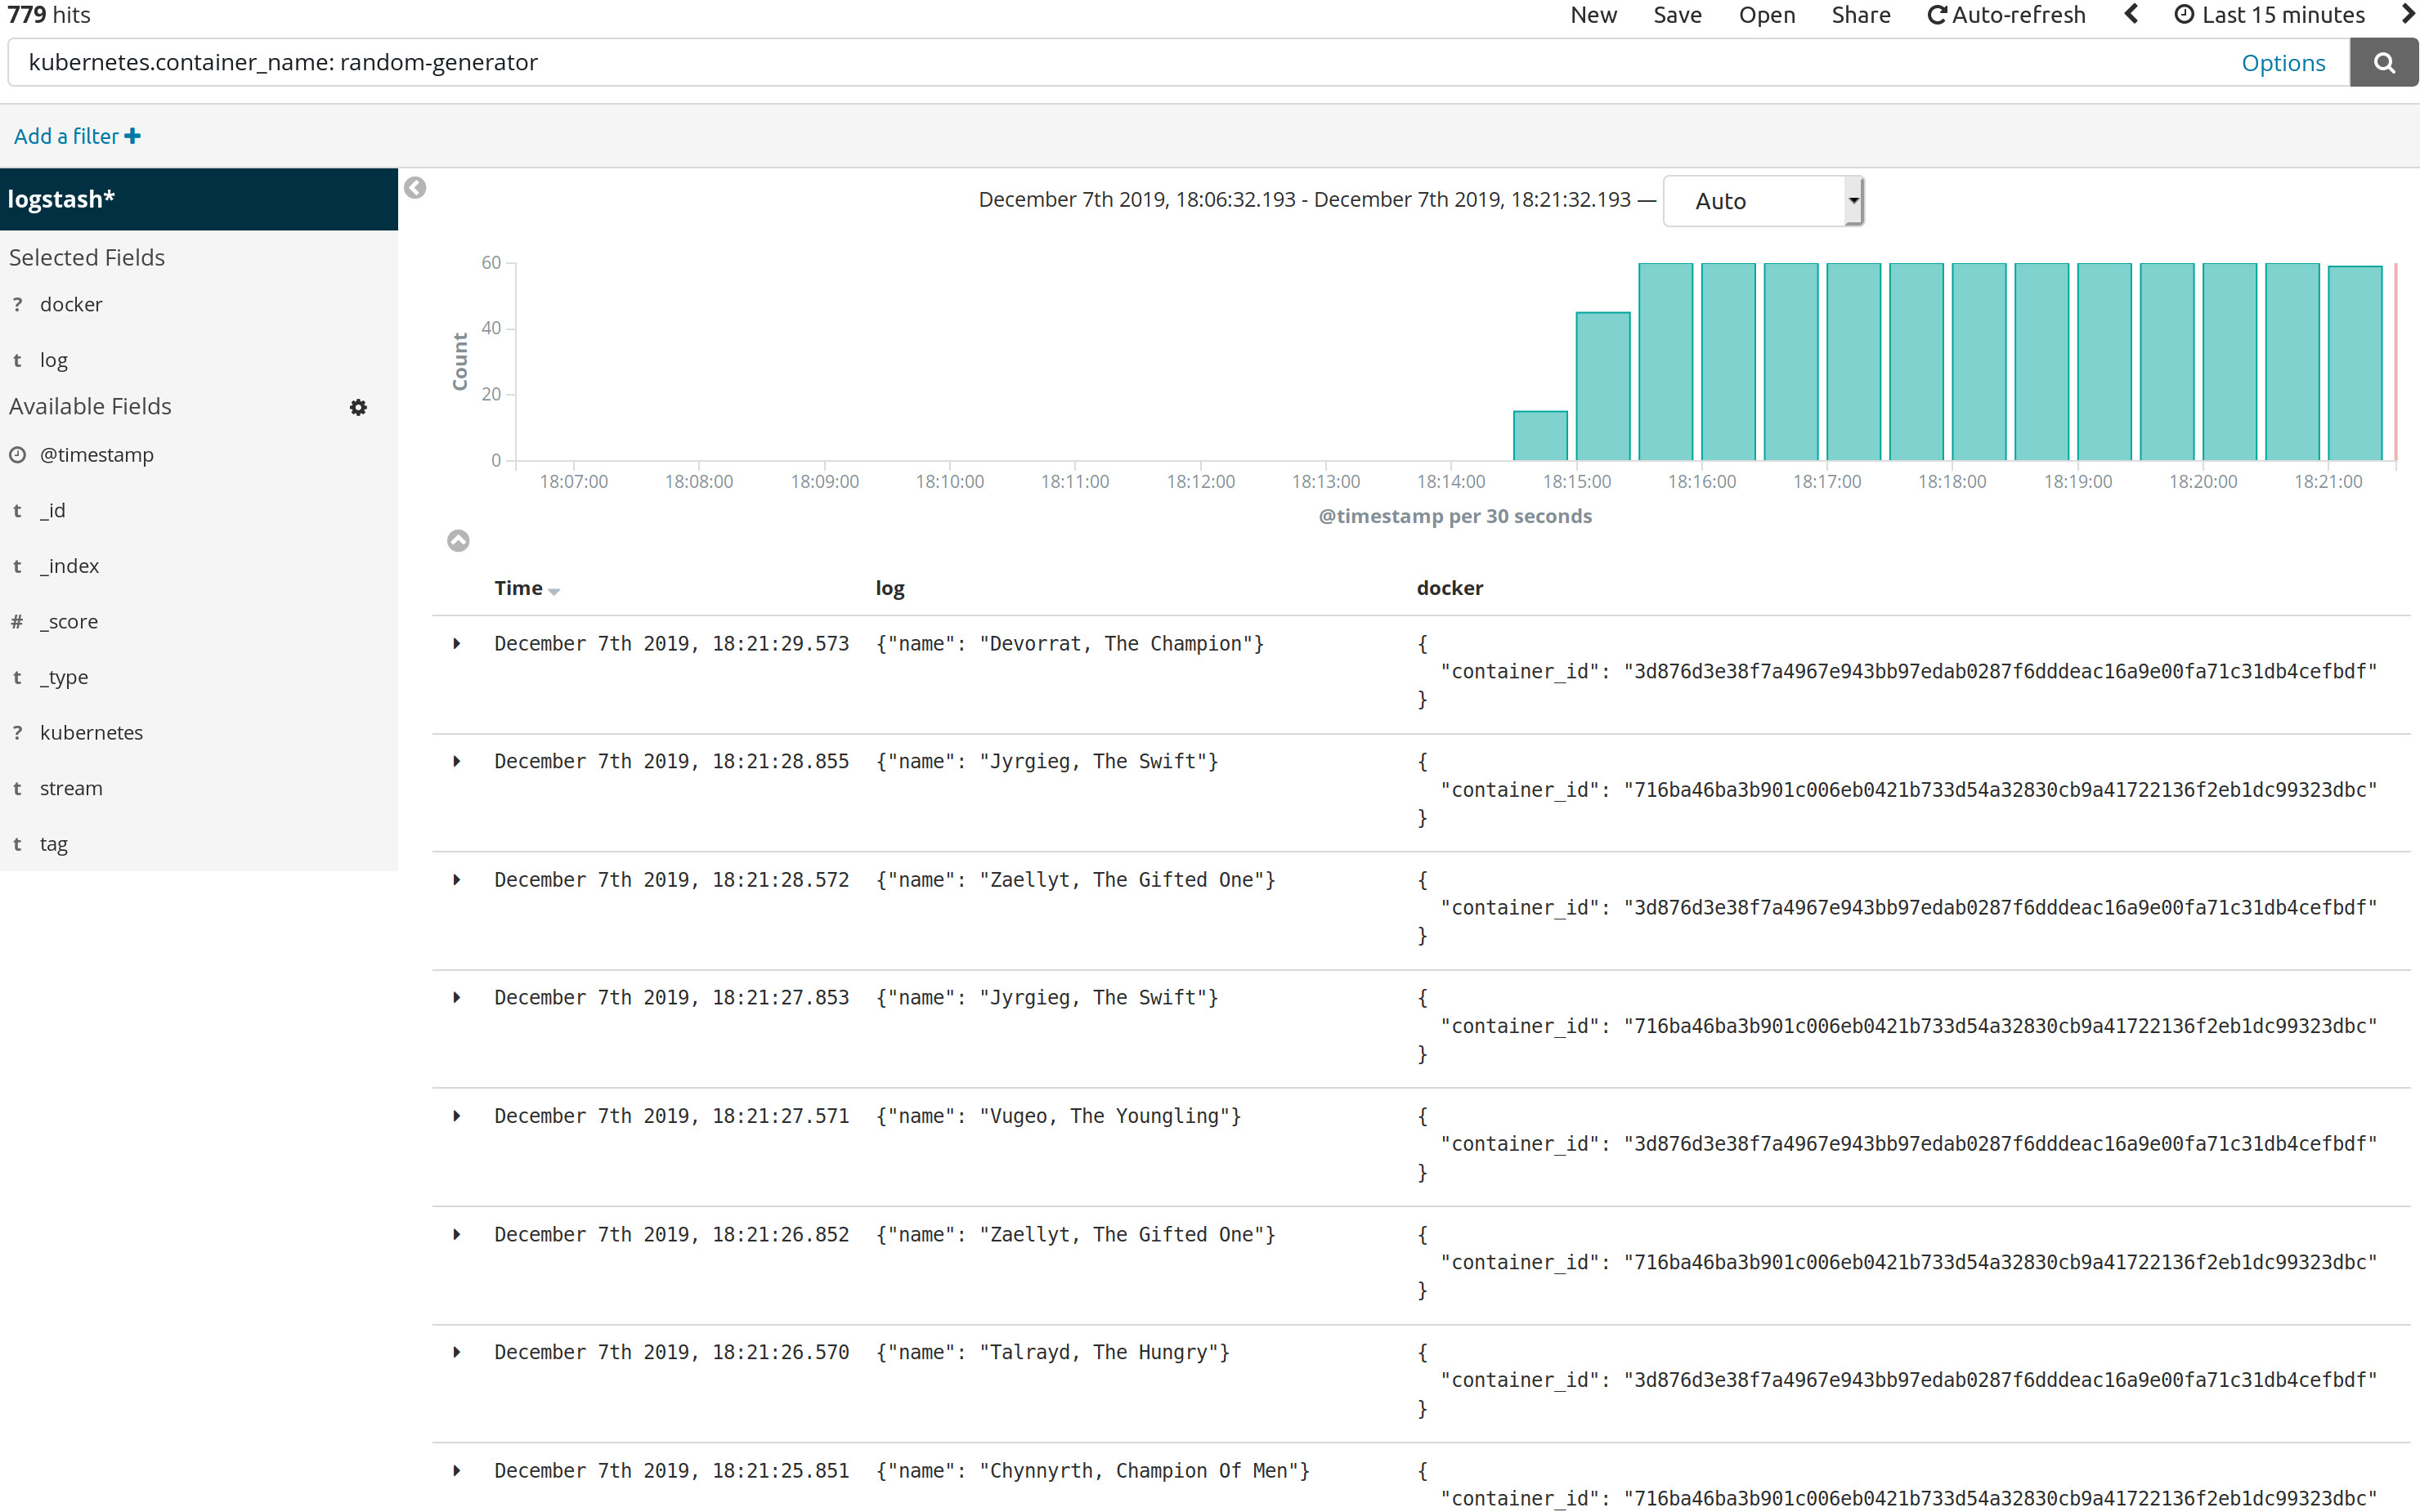
{"name": "Gorsolun, Warmheart"}Now back into Kibana we could just do a simple filter kubernetes.container_name: random-generator and select the docker and log fields to view the logs
of this application.
Configuring Grafana
As we did for Kibana we could grab the url for Grafana for the cluster info, this case is https://127.0.0.1:16443/api/v1/namespaces/kube-system/services/monitoring-grafana/proxy , we will need our admin user and password as we needed before.
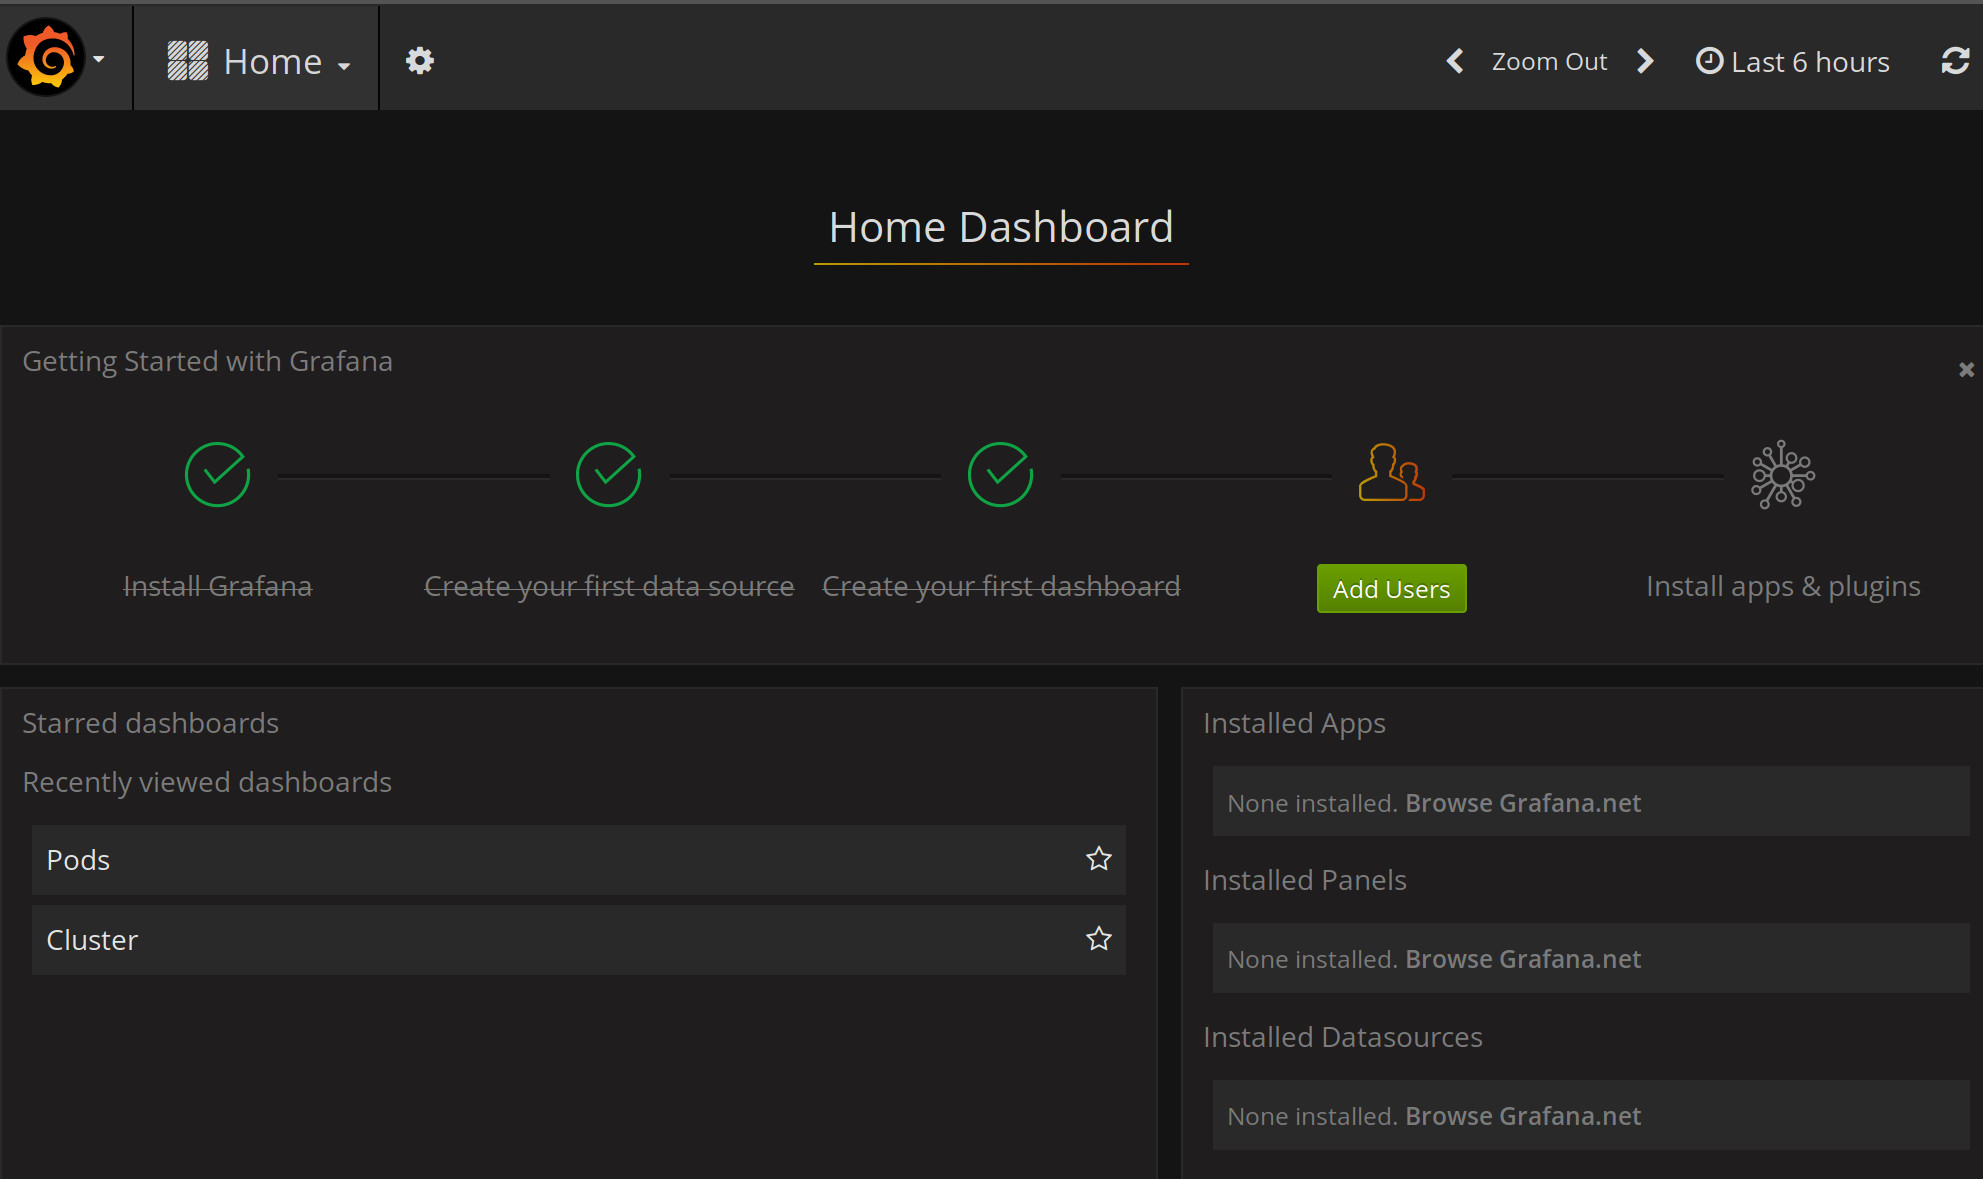
MicroK8s has already configure some dashboard we could choose Pods and then select our default namespace an any of our random-generator pods to look some of the graphs.
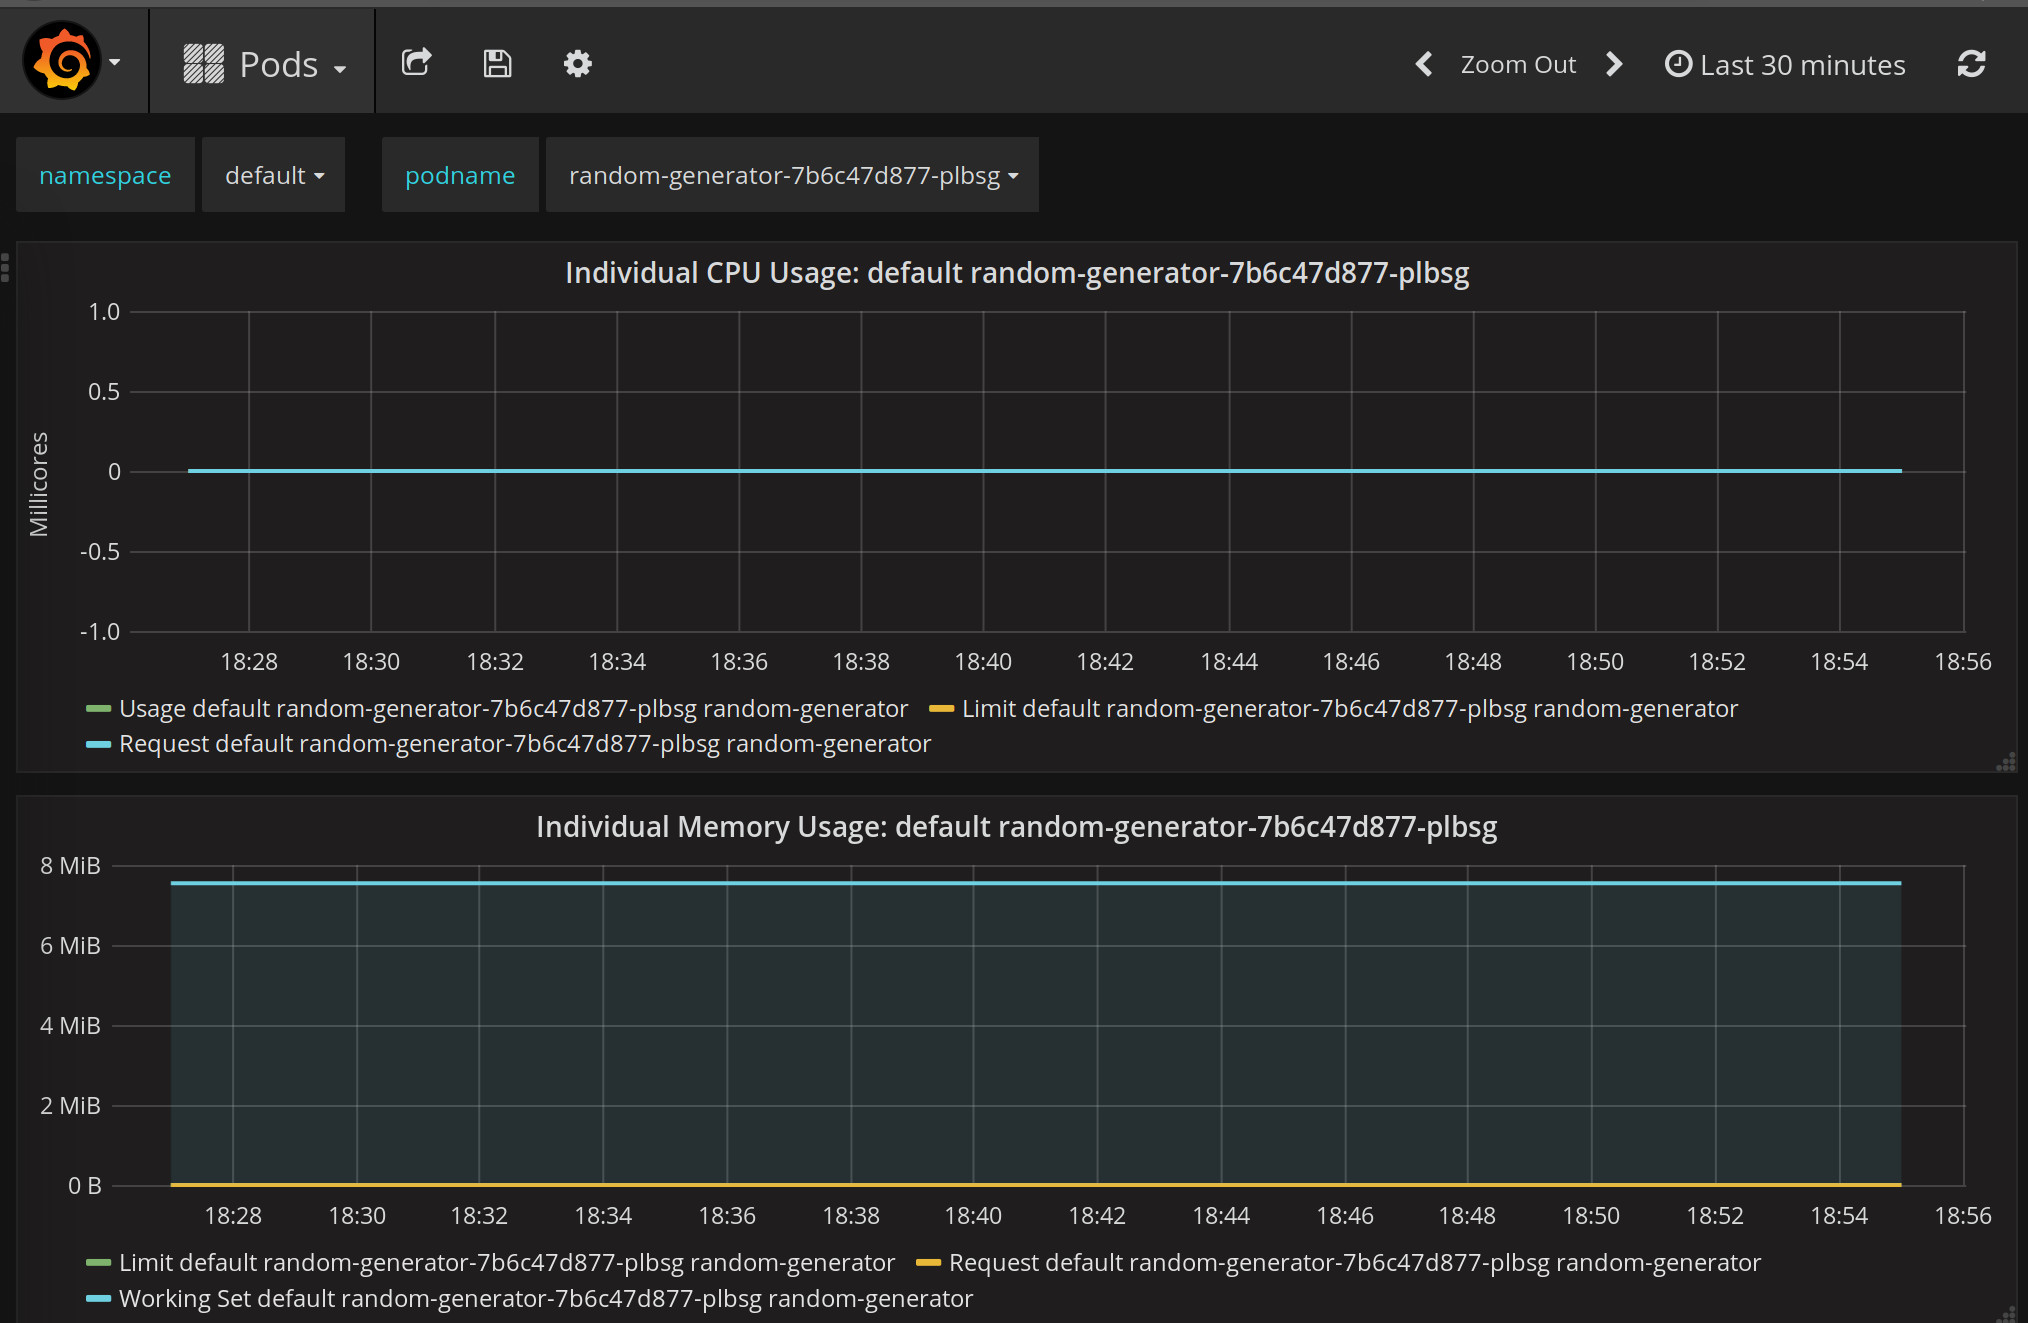
The defaul Pod dashboard allow us to just select one pod let modify it to allow to choose several.
Click on the gear icon on Grafana and choose Templating :
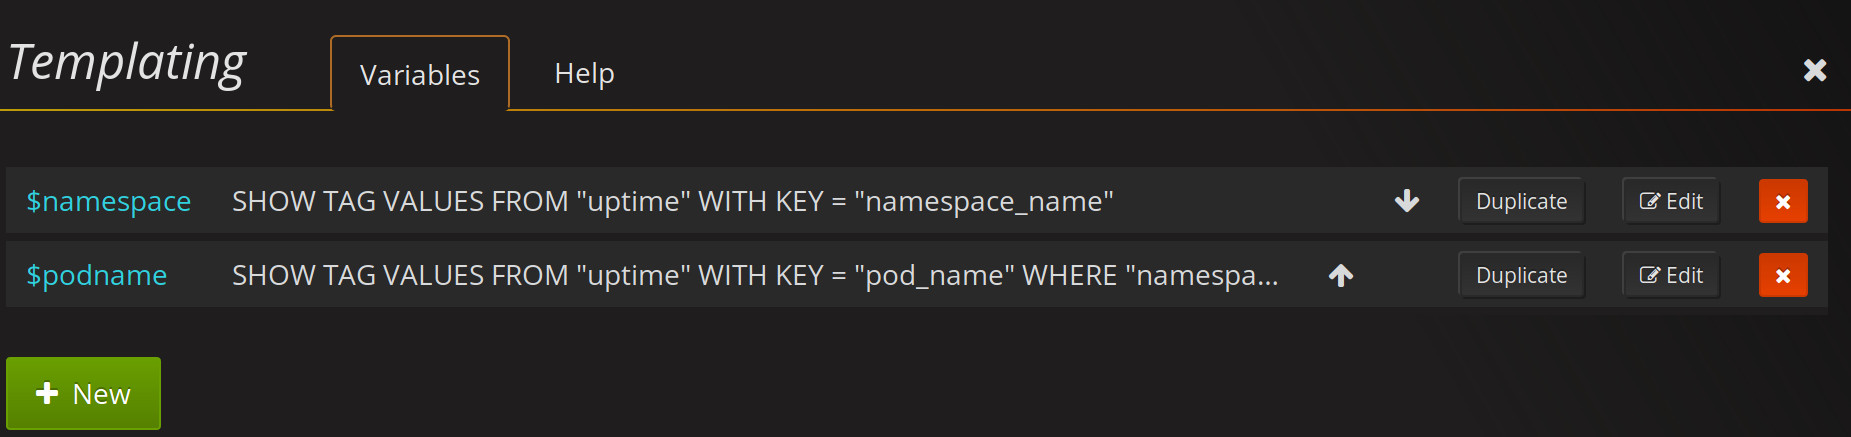
Now on the field $podname we click on the Edit button.
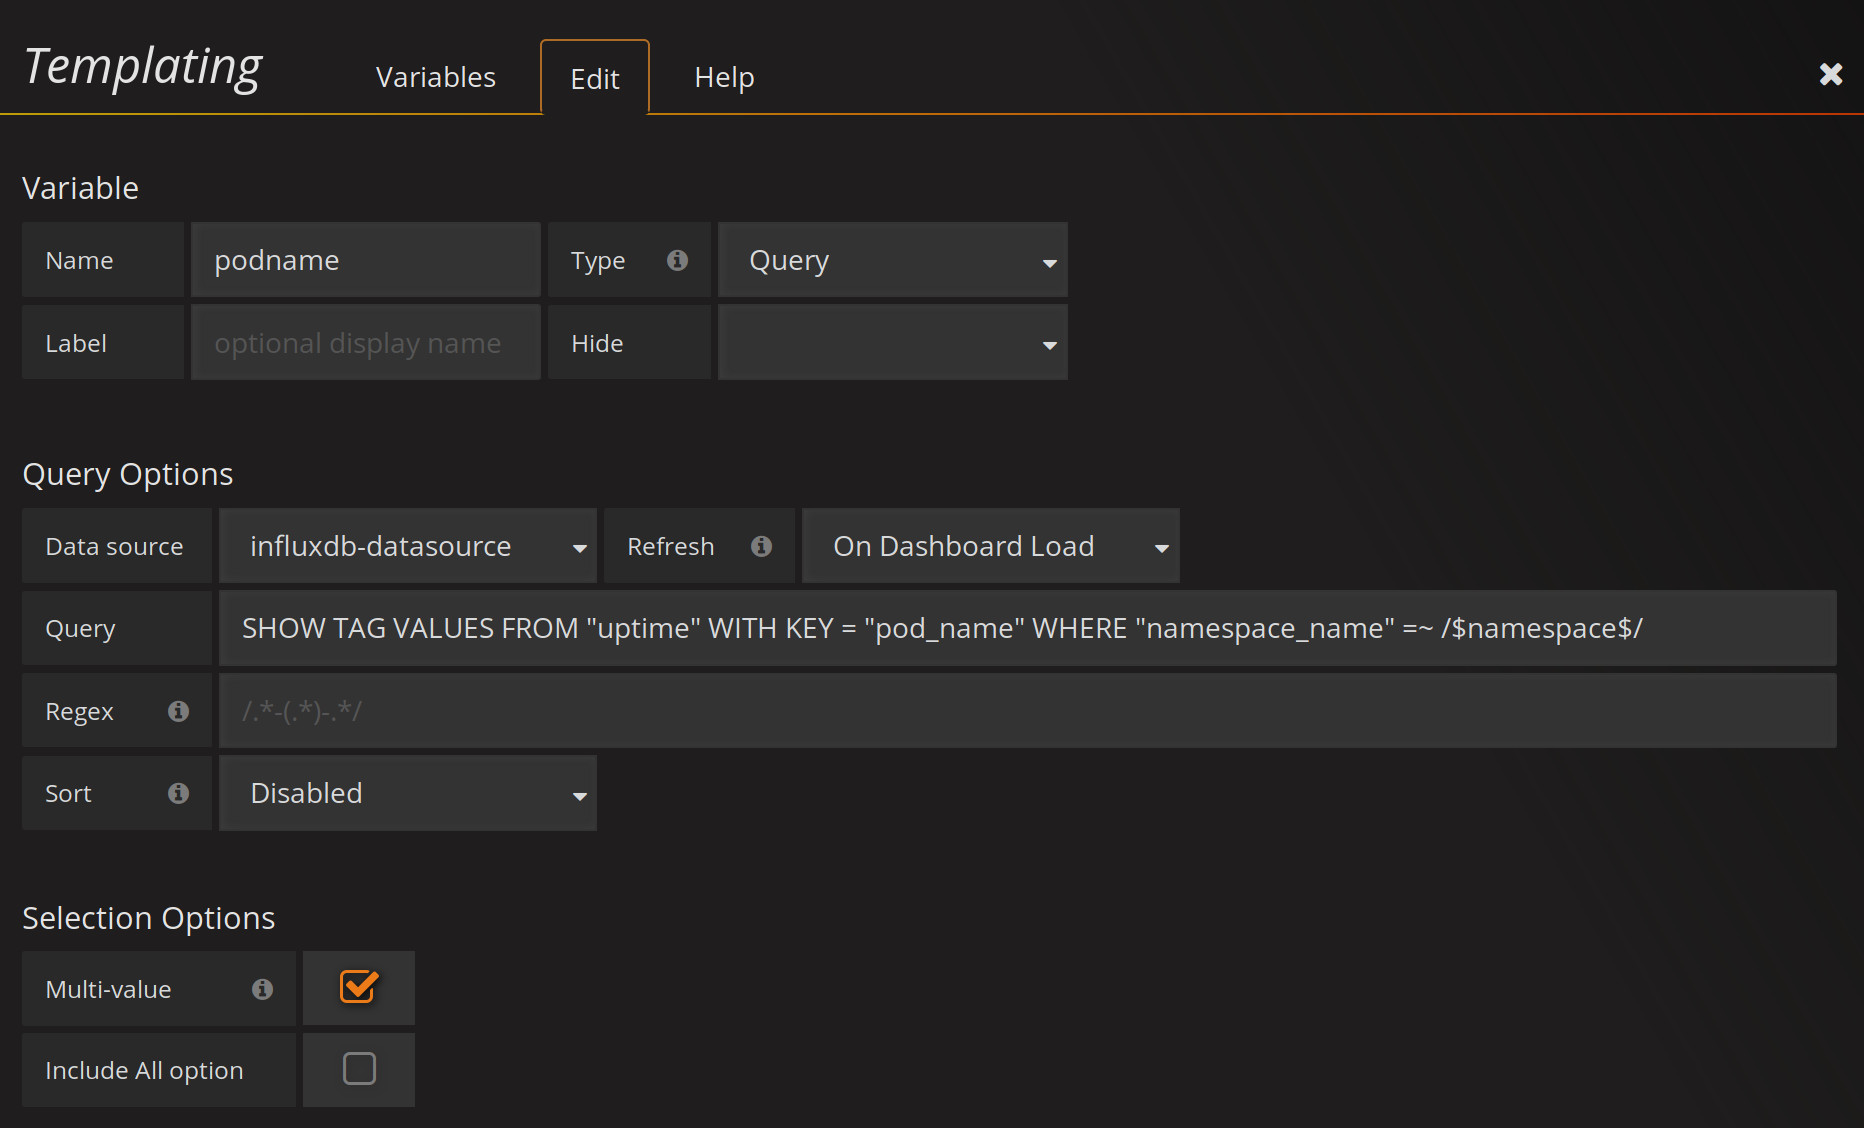
We need to activate Multi-value on the Selection Options and then click now Update, sometimes the field Data Source get set to blank we need to set it to influxdb-dataset.
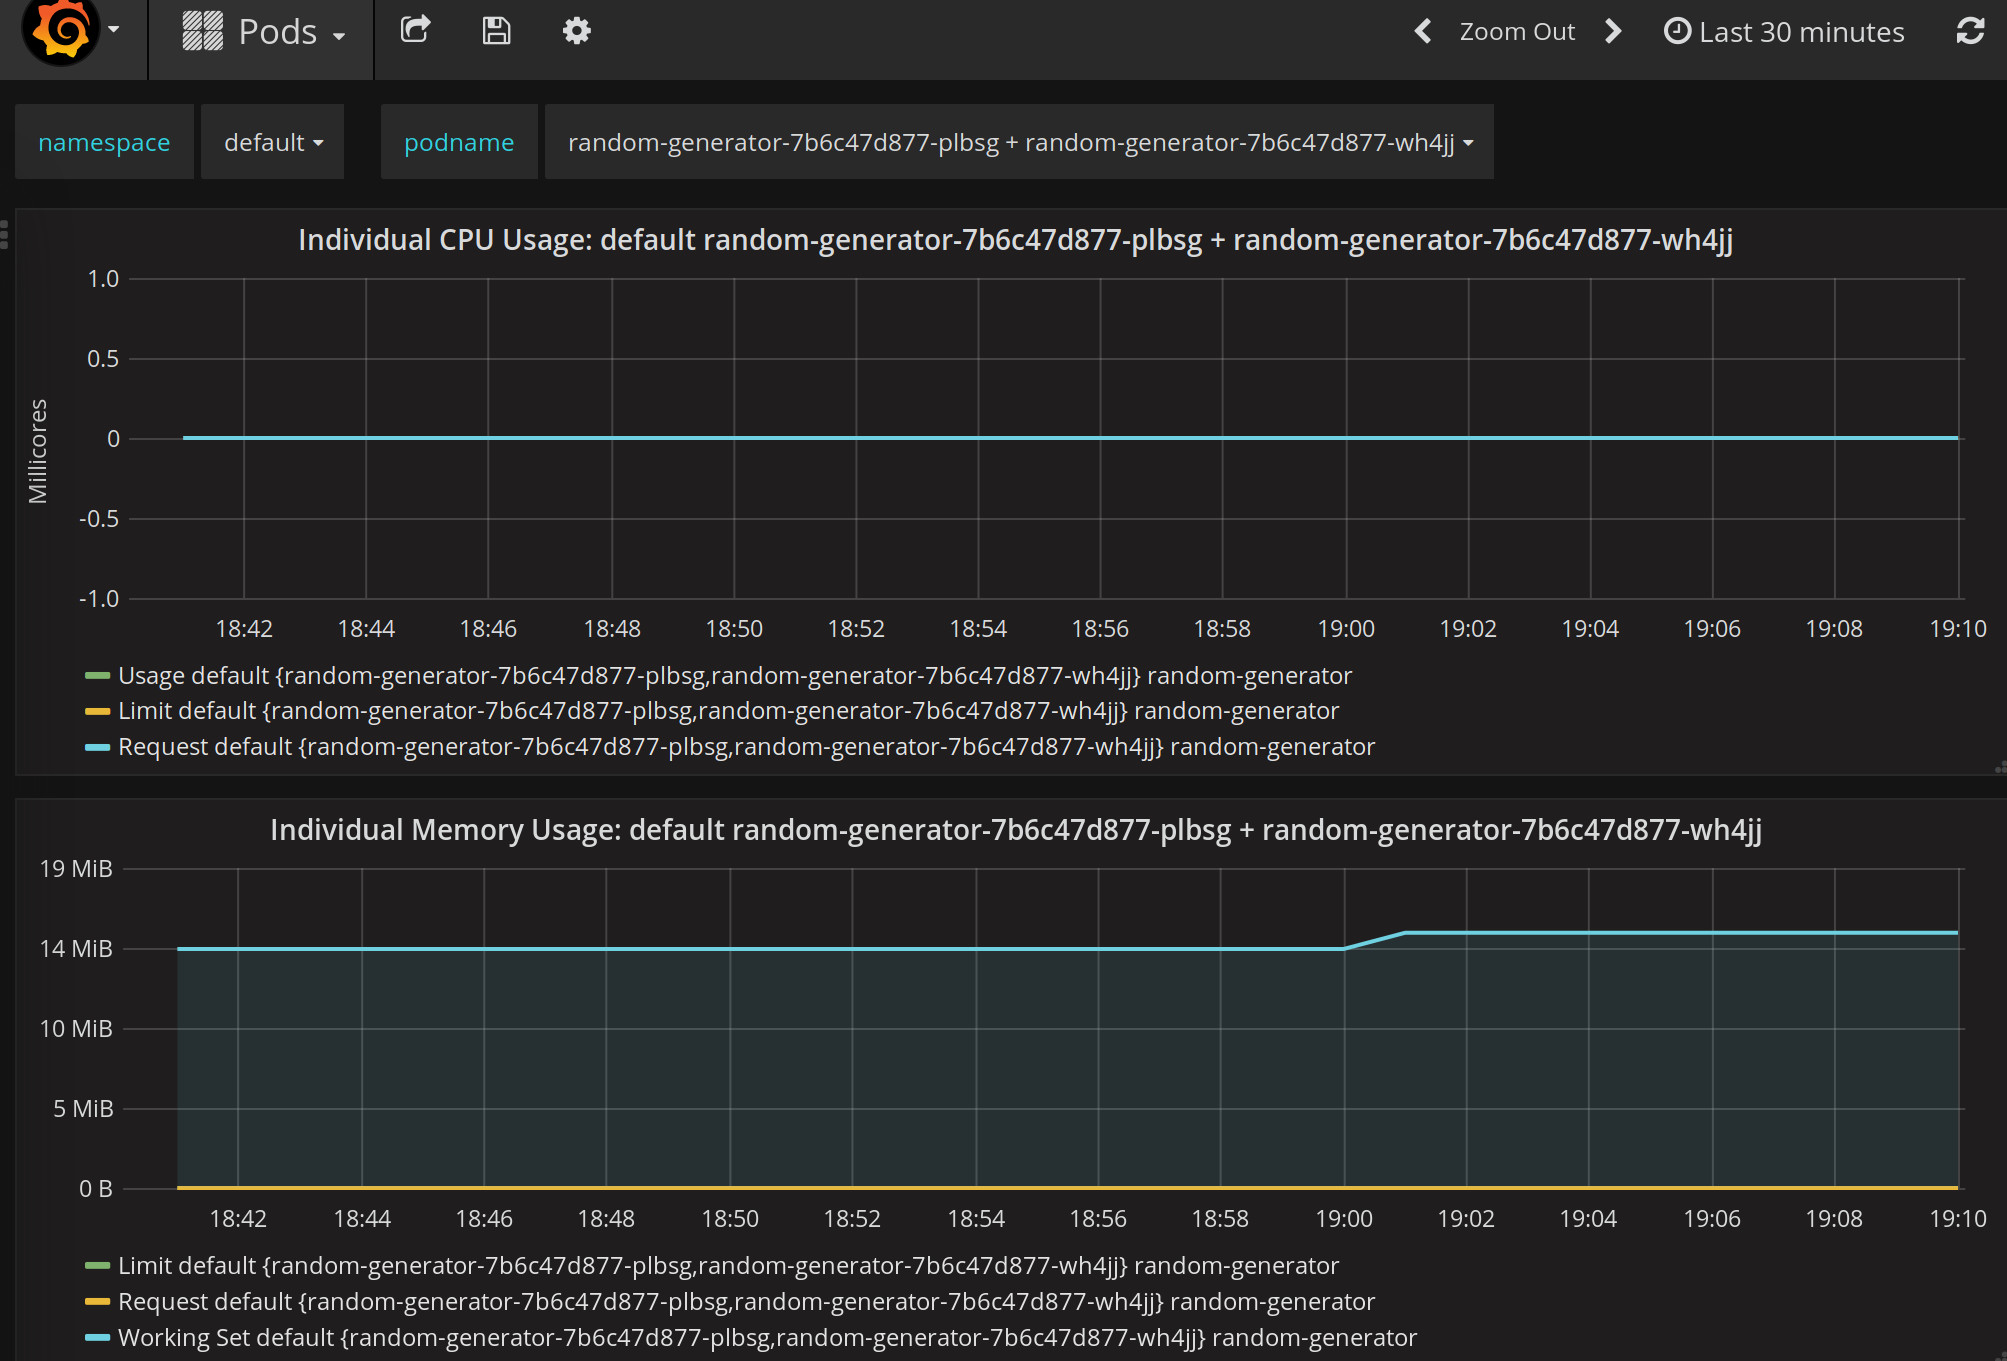
With this now could close the Templating and choose all of the pods for our random-generator to get an update graph with the sum of both pods.
Clean up
Now that we have test some of the tools in our MicroK8s installation we could delete the applications that we do not need anymore :
$ microk8s.kubectl delete all --selector=app=microbot
pod "microbot-5bb7fd7f5d-dshtf" deleted
pod "microbot-5bb7fd7f5d-mdcvs" deleted
service "microbot-service" deleted
deployment.apps "microbot" deleted
replicaset.apps "microbot-5bb7fd7f5d" deleted

$ microk8s.kubectl delete all --selector=app=random-generator
pod "random-generator-7b6c47d877-plbsg" deleted
pod "random-generator-7b6c47d877-wh4jj" deleted
deployment.apps "random-generator" deleted
replicaset.apps "random-generator-7b6c47d877" deleted
Conclusions
MicroK8s is very easy to install it took just seconds to download and get it ready, it provide many already config addons that allows use it easily and kickstart a k8s cluster very fast with everything that we need, and is really slim and fast so a really good candidate for IoT deployments.
I’ve enjoy a lot this installation and I’m looking forward to learn more of k8s using MicroK8s, they are several addons that I’ven’t tryout yet such Istio and Knative, maybe in a nearby future.
Reference