Some days ago we start this series of article with our base example, now we have baseline that we could use to optimize the service.
These are the number that we got, the ones that we will like to improve :
| C. Users | Pods | ART | TPS | Max CPU | Max MEM |
|---|---|---|---|---|---|
| 1 | 1 | 39.16 | 25.49 | 403 | 474 |
| 10 | 1 | 570.47 | 16.73 | 916 | 487 |
| 25 | 3 | 1615.82 | 14.72 | 1049 | 1454 |
| 50 | 5 | 3190.98 | 14.89 | 1351 | 2499 |
Java 8 - Spring Boot 2.2.2 - Spring Web - Spring Data JDBC default settings, unoptimized
Moving from Java 8 to Java 11
For this example we will first clone our original project :
$ git clone https://github.com/LearningByExample/movies-spring-web.git movies-spring-webNow we will rename all references in code, scripts, yaml and packages from movies-base-service to movies-spring-web
Them we will modify our pom.xml to use Java 11 :
    <properties>
        <java.version>11</java.version>
    </properties>
Finally we will change our Dockerfile to use the Java 11 base image :
FROM openjdk:11-jdk

COPY target/*.jar /usr/app/app.jar
WORKDIR /usr/app

CMD ["java", "-jar", "app.jar"]
With this changes we will build and deploy our new service :
$ ./build.sh
$ ./deploy.sh
We could now check that is deployed in our local cluster :
$ microk8s.kubectl get all --selector=app=movies-spring-web
NAME                                     READY   STATUS    RESTARTS   AGE
pod/movies-spring-web-66b94f8479-mmmxw   1/1     Running   0          17s

NAME                        TYPE        CLUSTER-IP       EXTERNAL-IP   PORT(S)    AGE
service/movies-spring-web   ClusterIP   10.152.183.195   <none>        8080/TCP   17s

NAME                                READY   UP-TO-DATE   AVAILABLE   AGE
deployment.apps/movies-spring-web   1/1     1            1           17s

NAME                                           DESIRED   CURRENT   READY   AGE
replicaset.apps/movies-spring-web-66b94f8479   1         1         1       17s
We could check that our service is running correctly with HTTPie :
$ http 10.152.183.195:8080/movies/sci-fi
HTTP/1.1 200
Connection: keep-alive
Content-Type: application/json
Date: Sat, 18 Jan 2020 12:20:31 GMT
Keep-Alive: timeout=60
Transfer-Encoding: chunked

[
    {
        "genres": [
            "Drama",
            "Sci-Fi"
        ],
        "id": 24,
        "title": "Powder",
        "year": 1995
    },
    {
        "genres": [
            "Adventure",
            "Drama",
            "Fantasy",
            "Mystery",
            "Sci-Fi"
        ],
        "id": 29,
        "title": "City of Lost Children, The (Cité des enfants perdus, La)",
        "year": 1995
    },
........
........
........
]
With this we could do our load test following exactly the procedure that we describe in our previous example, but this time only for 10 concurrent users.
$ ./load-test.sh 10 600 60Doing this we will get this results from the JMeter report and Grafana :
| Step | C. Users | Pods | ART | TPS | Max CPU | Max MEM |
|---|---|---|---|---|---|---|
| 01 base | 10 | 1 | 570.47 | 16.73 | 916 | 487 |
| 02 Java 11 | 10 | 1 | 517.01 | 18.47 | 875 | 918 |
Java 11
With this we could see that we have a better ART, TPS and Max CPU but we have increase the memory usage.
Creating a optimal JRE
One thing that we haven’t check so far is the size of our image, that may not be important for a performance perspective but it is for how fast our cluster could get install the image, let’s check it out with :
$ docker image ls localhost:32000/movies-spring-web:0.0.1
REPOSITORY                          TAG                 IMAGE ID            CREATED             SIZE
localhost:32000/movies-spring-web   0.0.1               491c3e0b1fdf        37 minutes ago      628MB
In java 11 we could use jlink to generate a optimize JRE distribution that will contains only what our application needs, for this we will create an script named jlink.sh :
#!/bin/sh -

set -o errexit

BASE_DIR="$(
  cd "$(dirname "$0")"
  pwd -P
)"

DEPS_DIR="$BASE_DIR/deps"

mkdir -p "$DEPS_DIR"

echo "extracting jar"
cd "$DEPS_DIR"
jar -xf ../*.jar
echo "jar extracted"

echo "generate JVM modules list"
EX_JVM_DEPS="jdk.crypto.ec"
JVM_DEPS=$(jdeps -s --multi-release 11 -recursive -cp BOOT-INF/lib/*.jar BOOT-INF/classes | \
  grep -Po '(java|jdk)\..*' | \
  sort -u | \
  tr '\n' ',')
MODULES="$JVM_DEPS$EX_JVM_DEPS"
echo "$MODULES"
echo "JVM modules list generated"

echo "doing jlink"
jlink \
    --verbose \
    --module-path "$JAVA_HOME/jmods", \
    --add-modules "$MODULES" \
    --compress 2 \
    --no-header-files \
    --no-man-pages \
    --strip-debug \
    --output "$DEPS_DIR/jre-jlink"

echo "jlink done"

cd "$BASE_DIR"
In this script we will uncompress our jar, use jdeps to find witch modules are in use, we will add additionally jdk.crypto.ec since we require to connect via ssl to our PostgreSQL cluster, and then produce a optimize JRE image using jlink.
Now we will modify our Dockerfile to perform a multi-stage build :
FROM openjdk:11 AS builder

COPY target/*.jar /app/app.jar
COPY jlink.sh /app/jlink.sh

WORKDIR /app
RUN ./jlink.sh

FROM openjdk:11-jre-slim

RUN rm -rf /usr/local/openjdk-11
COPY --from=builder /app/deps/jre-jlink /usr/local/openjdk-11
COPY --from=builder /app/app.jar /app/app.jar

WORKDIR /app

CMD ["java", "-jar", "app.jar"]
In this docker file we create a intermediate container named builder base on the openjdk 11 image, we will use this container to extract our application jar and invoke our jlink.sh script.
Them our Dockerfile will create a image base on the JRE 11 slim and will add our application and replace the provide JRE with the one that we created with jlink in the builder image. We use the base JRE image since our custom JRE requires libraries and configuration that are already present in that image.
We could build our container as before and the check the image size :
$ docker image ls localhost:32000/movies-spring-web:0.0.1
REPOSITORY                          TAG                 IMAGE ID            CREATED             SIZE
localhost:32000/movies-spring-web   0.0.1               3fc95b166643        10 seconds ago      279MB
Now we will run our performance test as before to get :
| Step | C. Users | Pods | ART | TPS | Max CPU | Max MEM |
|---|---|---|---|---|---|---|
| 01 base | 10 | 1 | 570.47 | 16.73 | 916 | 487 |
| 02 Java 11 | 10 | 1 | 517.01 | 18.47 | 875 | 918 |
| 03 jlink | 10 | 1 | 518.97 | 18.41 | 875 | 787 |
jlink
We could see that there is not major changes using a JRE build with jlink, our docker is just smaller, that will help when we need to install a image into our cluster but will not benefit in overall to response time or even the memory that we use.
Checking the Memory Usage
The things that sound a bit odd and we will try to explain next is why we are using so much memory, so we need a tool to understand this futher so we will use VisualVM, but first we will need to modify our deployment in order been able to pass parameters to the JVM when we start our service, and we will to enable the JMX port that we will use.
First we will modify our Dockerfile :
FROM openjdk:11 AS builder

COPY target/*.jar /app/app.jar
COPY jlink.sh /app/jlink.sh

WORKDIR /app
RUN ./jlink.sh

FROM openjdk:11-jre-slim

RUN rm -rf /usr/local/openjdk-11
COPY --from=builder /app/deps/jre-jlink /usr/local/openjdk-11
COPY --from=builder /app/app.jar /app/app.jar

WORKDIR /app

ENTRYPOINT ["sh", "-c", "java ${JAVA_OPTS} -jar /app/app.jar"]
We will have now an environment variable named JAVA_OPTS to set additional parameters when running our java service.
Now we will modify our deployment.yml :
apiVersion: apps/v1
kind: Deployment
metadata:
  creationTimestamp: null
  labels:
    app: movies-spring-web
  name: movies-spring-web
spec:
  replicas: 1
  selector:
    matchLabels:
      app: movies-spring-web
  strategy: {}
  template:
    metadata:
      creationTimestamp: null
      labels:
        app: movies-spring-web
    spec:
      containers:
        - image: localhost:32000/movies-spring-web:0.0.1
          imagePullPolicy: Always
          name: movies-spring-web
          resources: {}
          env:
            - name: "JAVA_OPTS"
              value: >-
                -Dcom.sun.management.jmxremote
                -Dcom.sun.management.jmxremote.port=12345
                -Dcom.sun.management.jmxremote.authenticate=false
                -Dcom.sun.management.jmxremote.ssl=false
          readinessProbe:
            httpGet:
              path: /actuator/health
              port: 8080
          livenessProbe:
            httpGet:
              path: /actuator/info
              port: 8080
          volumeMounts:
            - name: db-credentials
              mountPath: "/etc/movies-db"
              readOnly: true
            - name: tmp
              mountPath: "/tmp"
              readOnly: false
      volumes:
        - name: db-credentials
          secret:
            secretName: moviesuser.movies-db-cluster.credentials
        - name: tmp
          emptyDir: {}
status: {}
---
apiVersion: v1
kind: Service
metadata:
  creationTimestamp: null
  labels:
    app: movies-spring-web
  name: movies-spring-web
spec:
  ports:
    - name: 8080-8080
      port: 8080
      protocol: TCP
      targetPort: 8080
  selector:
    app: movies-spring-web
  type: ClusterIP
status:
  loadBalancer: {}
But in order to use JMX we need to add to our jlink.sh the jdk.management.agent module :
#!/bin/sh -

set -o errexit

BASE_DIR="$(
  cd "$(dirname "$0")"
  pwd -P
)"

DEPS_DIR="$BASE_DIR/deps"

mkdir -p "$DEPS_DIR"

echo "extracting jar"
cd "$DEPS_DIR"
jar -xf ../*.jar
echo "jar extracted"

echo "generate JVM modules list"
EX_JVM_DEPS="jdk.crypto.ec,jdk.management.agent"
JVM_DEPS=$(jdeps -s --multi-release 11 -recursive -cp BOOT-INF/lib/*.jar BOOT-INF/classes | \
  grep -Po '(java|jdk)\..*' | \
  sort -u | \
  tr '\n' ',')
MODULES="$JVM_DEPS$EX_JVM_DEPS"
echo "$MODULES"
echo "JVM modules list generated"

echo "doing jlink"
jlink \
    --verbose \
    --module-path "$JAVA_HOME/jmods", \
    --add-modules "$MODULES" \
    --compress 2 \
    --no-header-files \
    --no-man-pages \
    --strip-debug \
    --output "$DEPS_DIR/jre-jlink"

echo "jlink done"

cd "$BASE_DIR"
Not we will and deploy our application.
$ ./build.sh
$ ./deploy.sh
Now we will forward our port 12345 for the pod to our localhost :
$ microk8s.kubectl get pod --selector=app=movies-spring-web
NAME READY STATUS RESTARTS AGE
movies-spring-web-6554d5fd68-kxvxg 1/1 Running 0 7m52s
$ microk8s.kubectl port-forward movies-spring-web-6554d5fd68-kxvxg 12345:12345
Forwarding from 127.0.0.1:12345 -> 12345
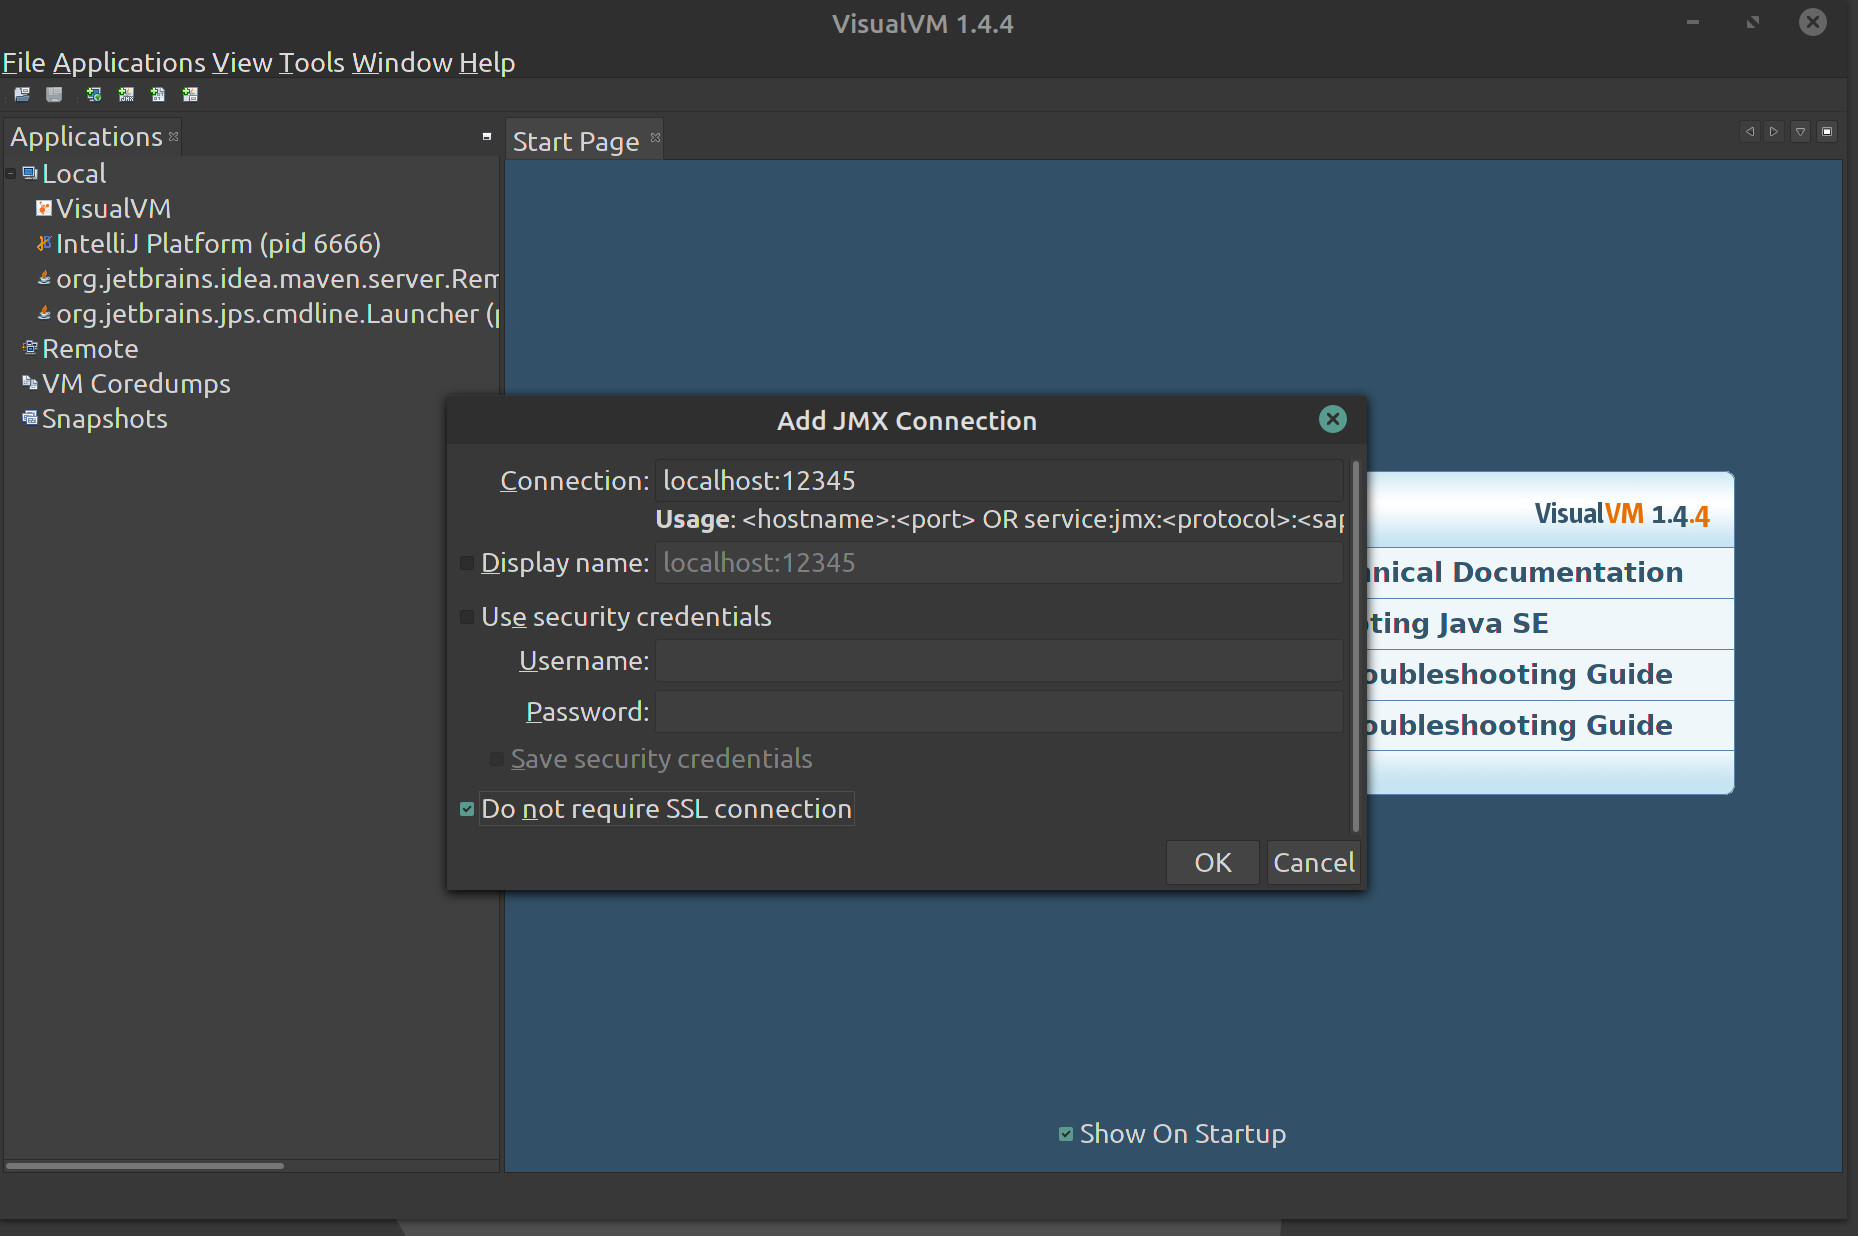
Forwarding from [::1]:12345 -> 12345Now we should open VisualVM and add a JMX connection to our service on locahost:12345 :
Now we could click on our application and the select the tab monitor to see some graphs, I choose to only see CPU and threads :

As we could see our heap is about 1GB, with a maximun of 16GB however we are only using 80M at peak, we could see in the CPU that our garbage collector is almost doing nothing until he enter a cleaning cycle the an small CPU usage and our heap usage drops.
In this moment we do not have any traffic on the service, lest run our load test for a couple of minutes.
$ ./load-test.sh 10 120 30I’ll leave a couple of minutes after the test to wait that the garbage collector start again and grab more data from VisualVM :
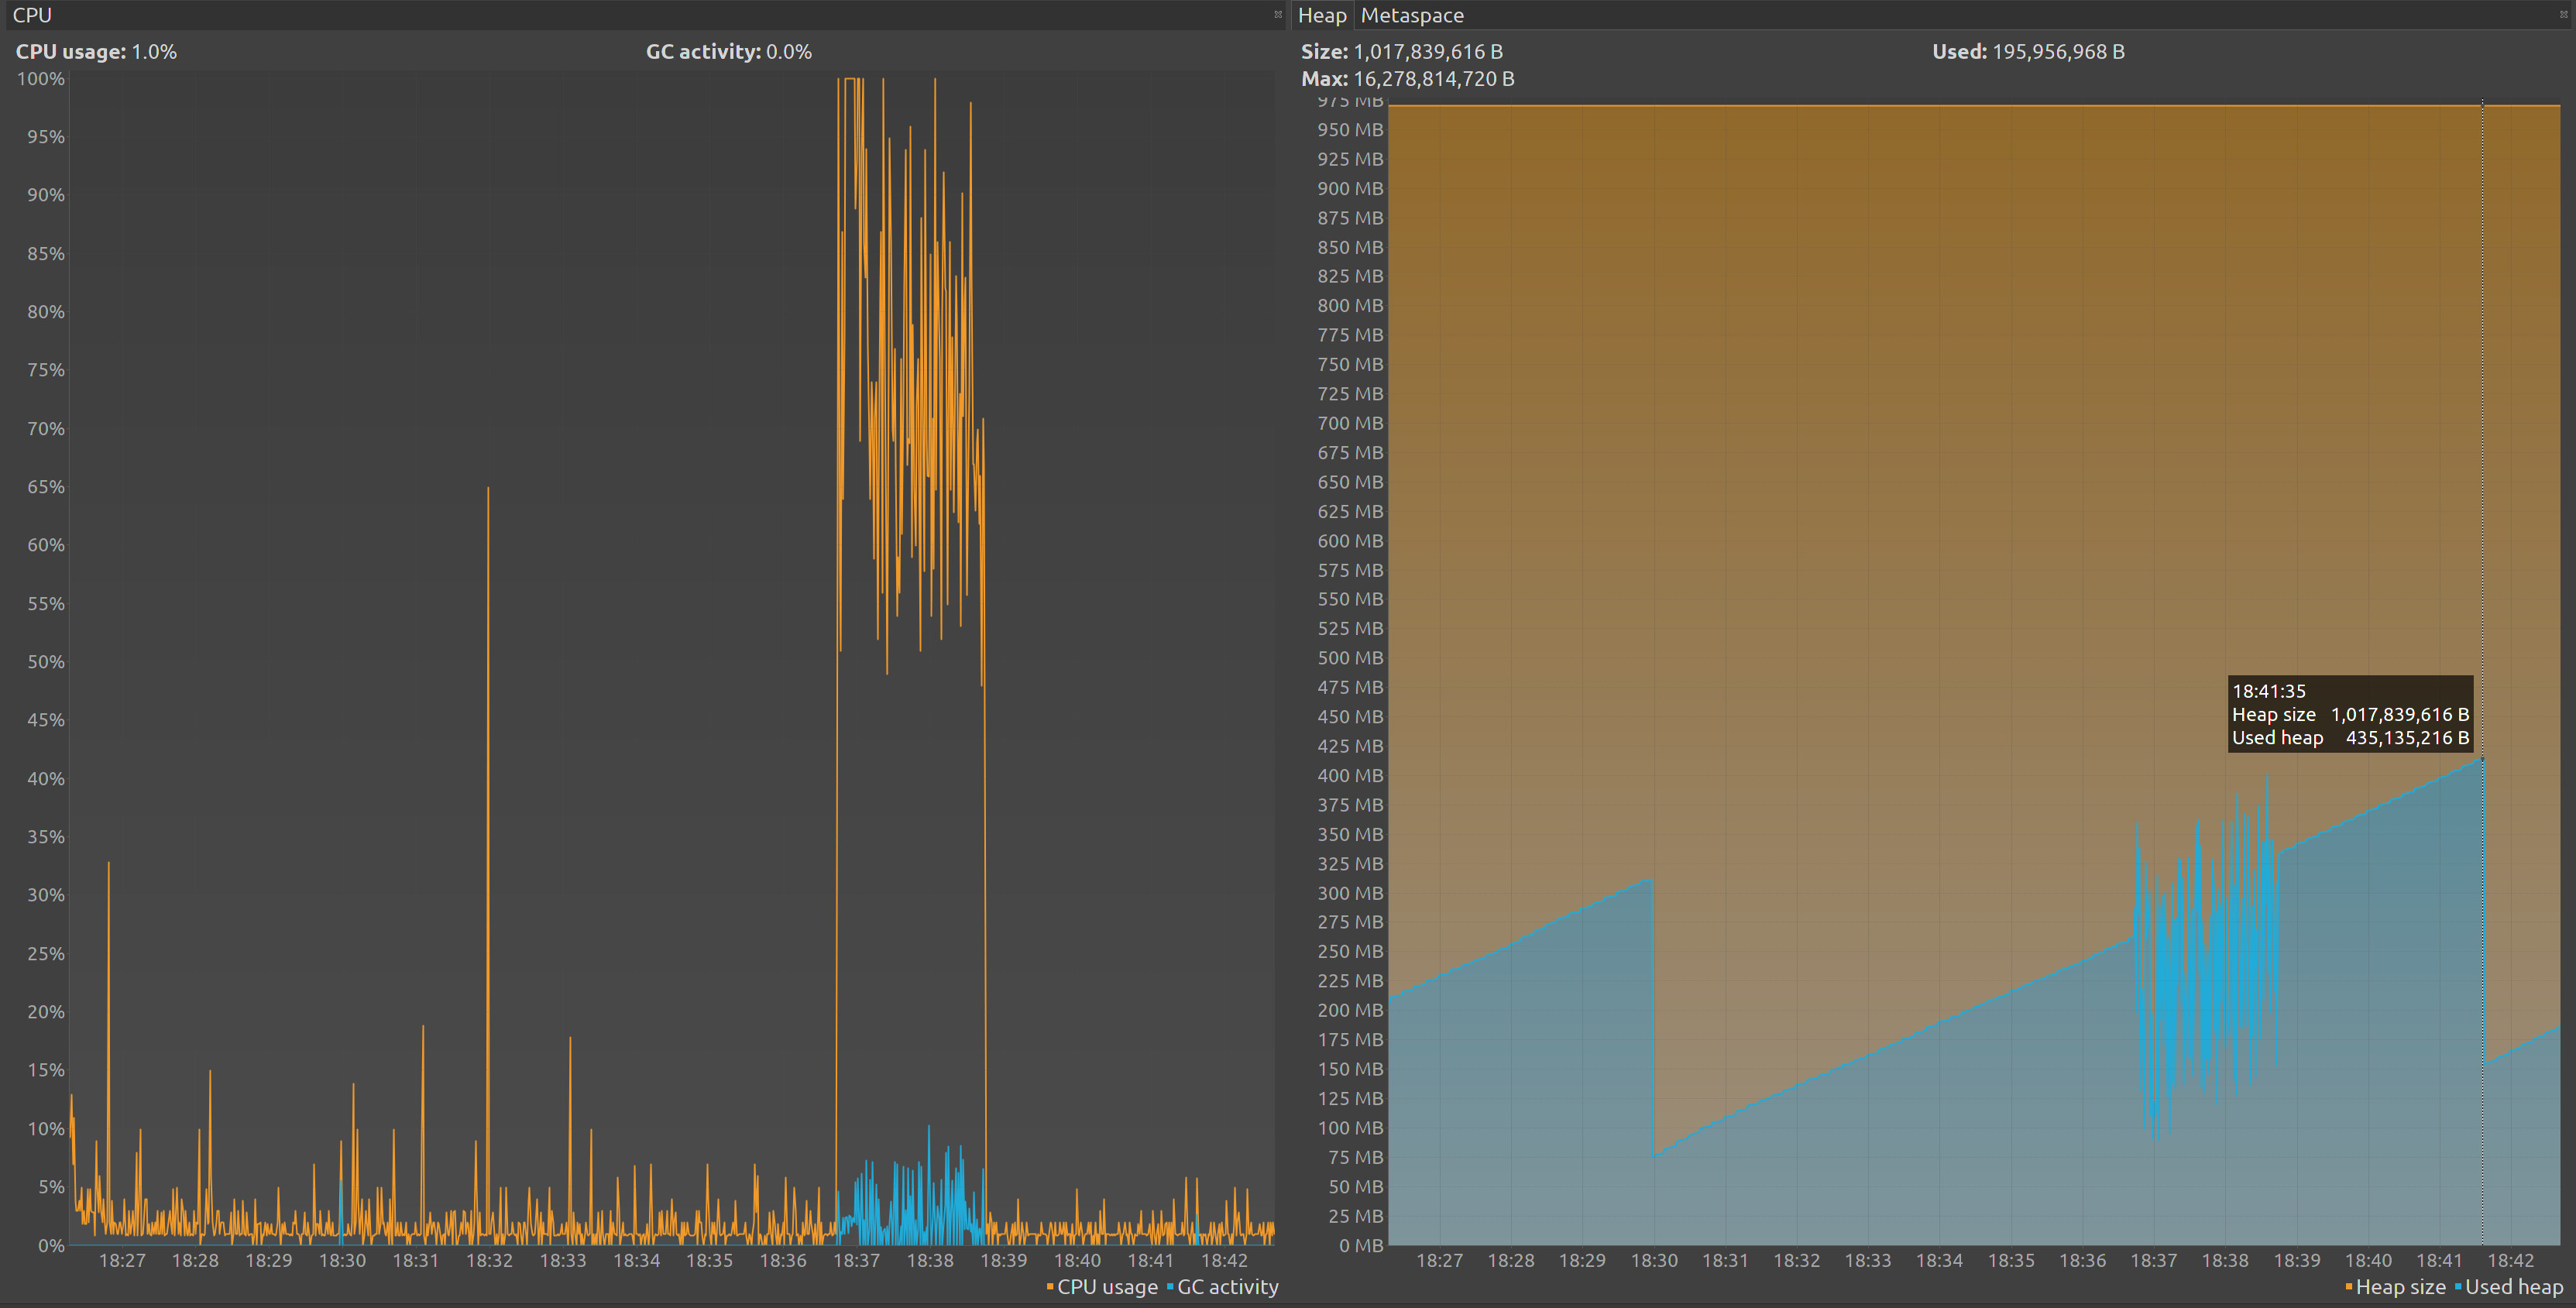
As we could see know we use around 435M of heap, and the gc busy during our test, them we could see how drops afterwards.
Let’s make a bit of sense on what we have seen so far.
First we do not specify any memory limit on the deployment of our containers so that’s the reason that our maximum heap is set to 16G, them even without using much initial heap but the JVM is prepare to use a full G if need, up to 16G if needs more.
Our garbage collector is trying to do it best to keep up and clean memory when he could.
To just test some limit we could run more test with different loads but I think that with 450M should be ok and starting with 250M, so I going to change our VM options in our deployment :
apiVersion: apps/v1
kind: Deployment
metadata:
  creationTimestamp: null
  labels:
    app: movies-spring-web
  name: movies-spring-web
spec:
  replicas: 1
  selector:
    matchLabels:
      app: movies-spring-web
  strategy: {}
  template:
    metadata:
      creationTimestamp: null
      labels:
        app: movies-spring-web
    spec:
      containers:
        - image: localhost:32000/movies-spring-web:0.0.1
          imagePullPolicy: Always
          name: movies-spring-web
          resources: {}
          env:
            - name: "JAVA_OPTS"
              value: >-
                -Xms250m
                -Xmx450m
                -Dcom.sun.management.jmxremote
                -Dcom.sun.management.jmxremote.port=12345
                -Dcom.sun.management.jmxremote.authenticate=false
                -Dcom.sun.management.jmxremote.ssl=false
          readinessProbe:
            httpGet:
              path: /actuator/health
              port: 8080
          livenessProbe:
            httpGet:
              path: /actuator/info
              port: 8080
          volumeMounts:
            - name: db-credentials
              mountPath: "/etc/movies-db"
              readOnly: true
            - name: tmp
              mountPath: "/tmp"
              readOnly: false
      volumes:
        - name: db-credentials
          secret:
            secretName: moviesuser.movies-db-cluster.credentials
        - name: tmp
          emptyDir: {}
status: {}
---
apiVersion: v1
kind: Service
metadata:
  creationTimestamp: null
  labels:
    app: movies-spring-web
  name: movies-spring-web
spec:
  ports:
    - name: 8080-8080
      port: 8080
      protocol: TCP
      targetPort: 8080
  selector:
    app: movies-spring-web
  type: ClusterIP
status:
  loadBalancer: {}
We do not need to build our application again, since we are not changing our docker just deploy it :
$ ./deploy.shNow we will forward the port again them connect with VisualVM and repeat the test for get a new graph :
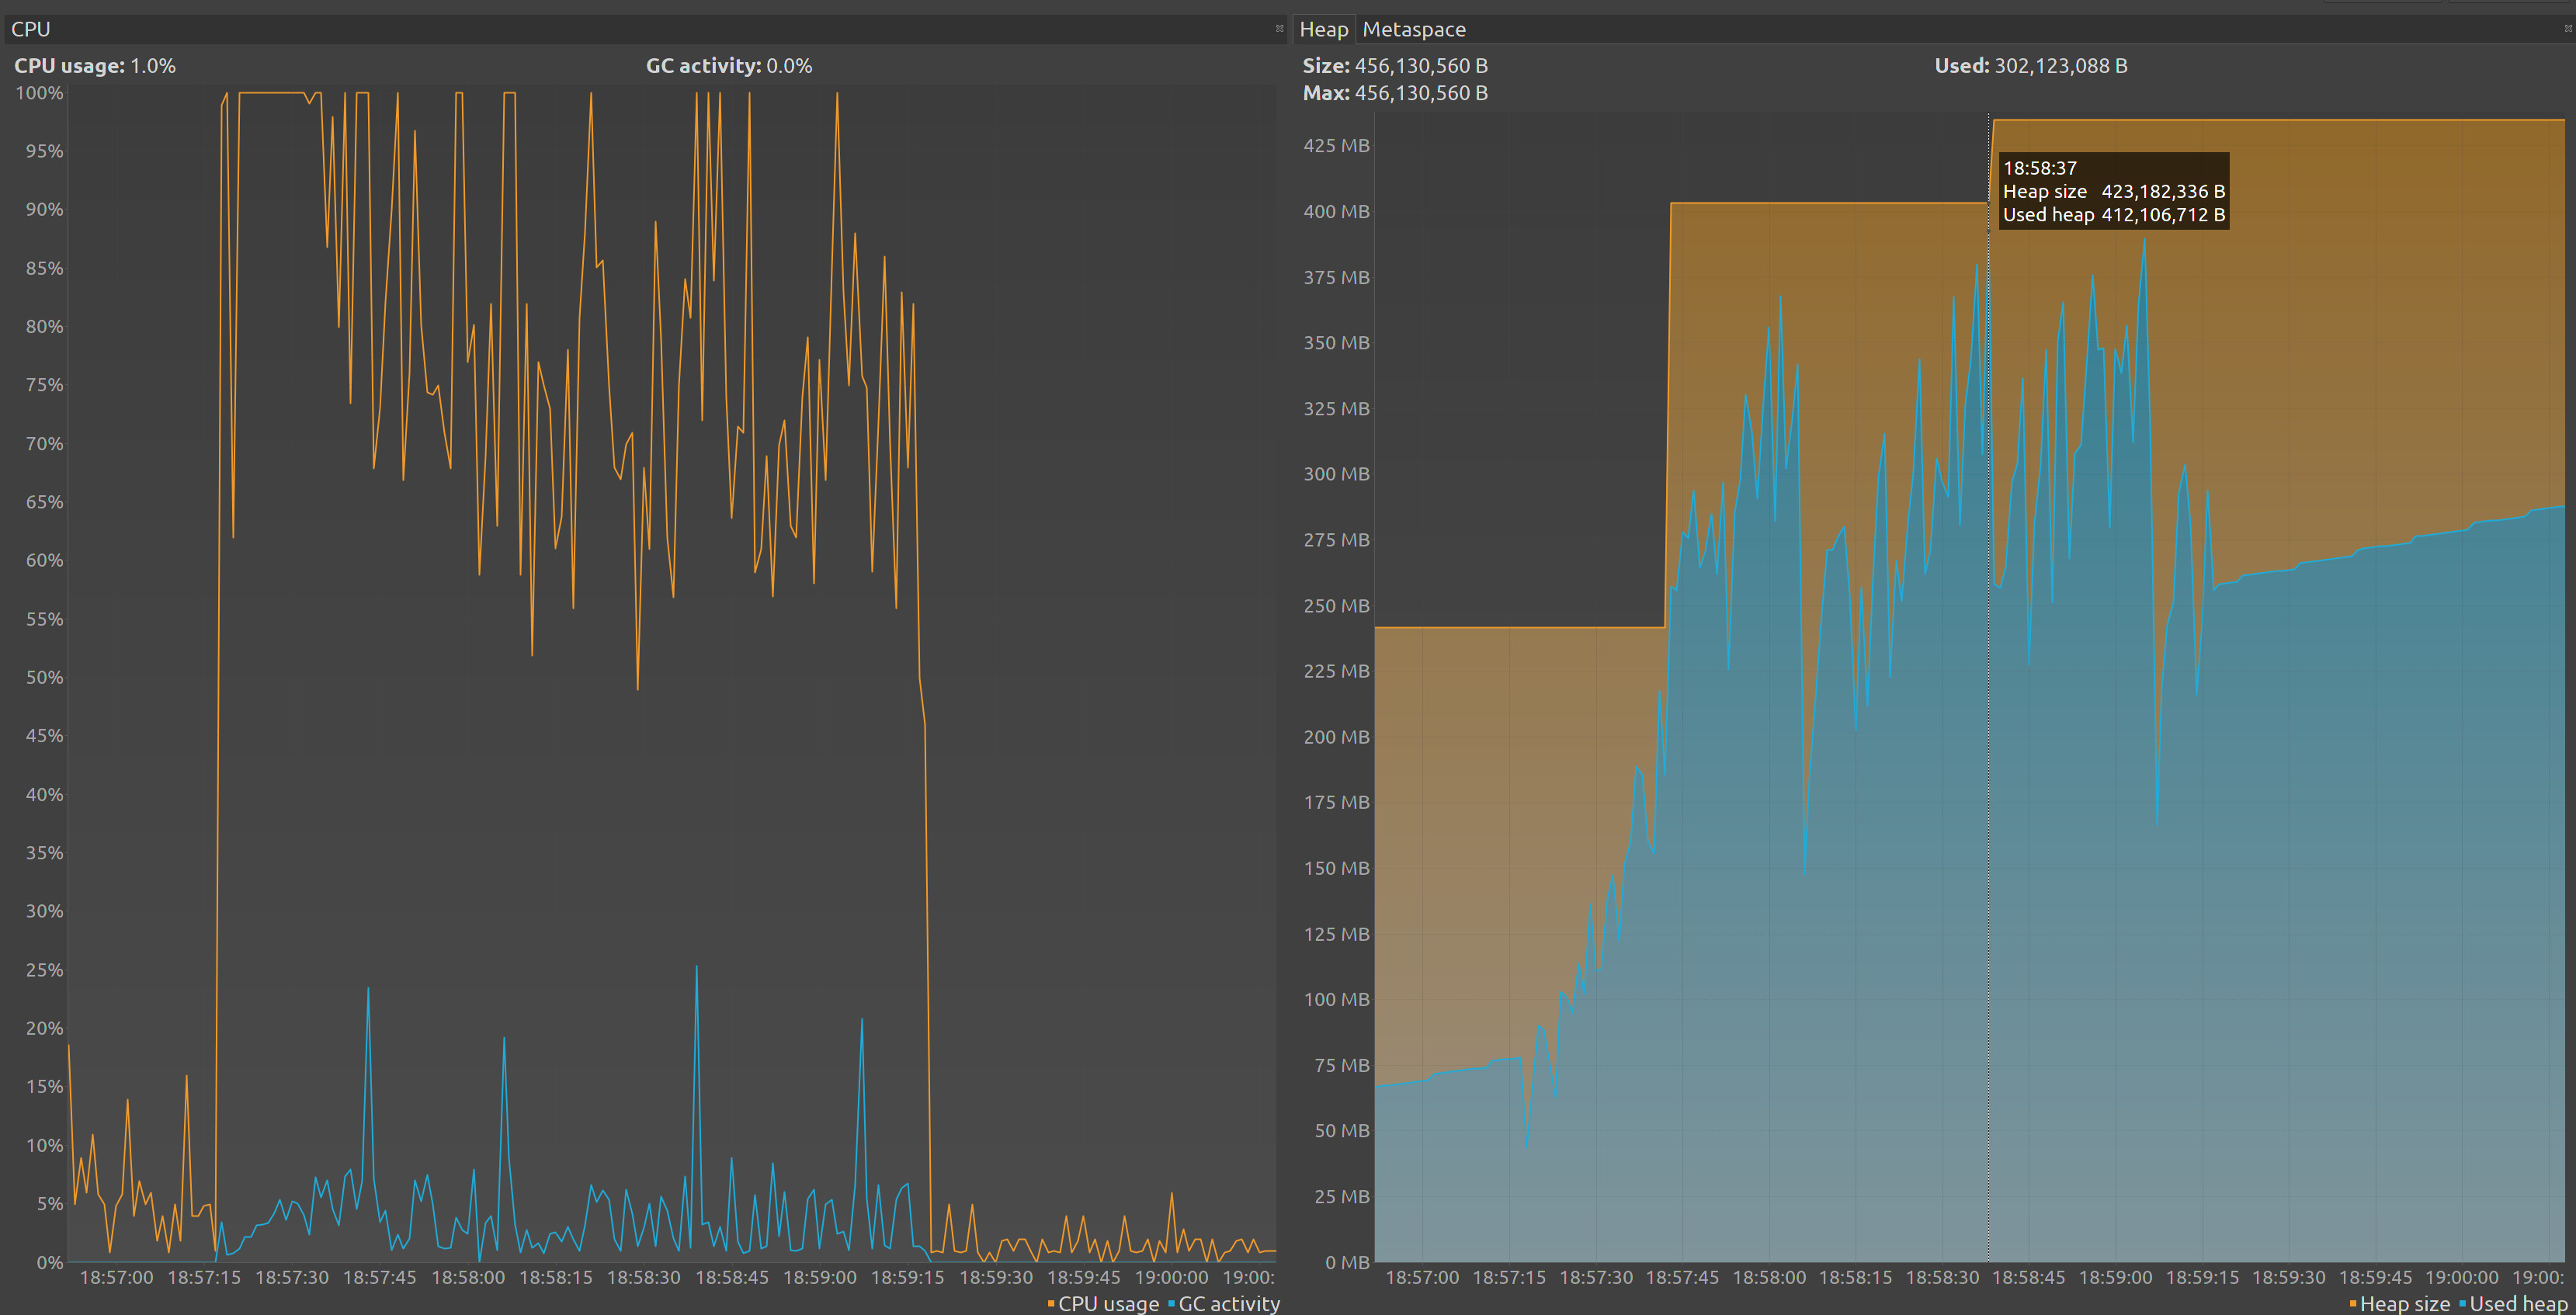
Now we could see that our memory is better utilize, let’s now restart our cluster and run our performance test again to check how it perform in comparison with the previous tests, first we modify our deployment to remove the jmx port but keep the heap configuration:
apiVersion: apps/v1
kind: Deployment
metadata:
  creationTimestamp: null
  labels:
    app: movies-spring-web
  name: movies-spring-web
spec:
  replicas: 1
  selector:
    matchLabels:
      app: movies-spring-web
  strategy: {}
  template:
    metadata:
      creationTimestamp: null
      labels:
        app: movies-spring-web
    spec:
      containers:
        - image: localhost:32000/movies-spring-web:0.0.1
          imagePullPolicy: Always
          name: movies-spring-web
          resources: {}
          env:
            - name: "JAVA_OPTS"
              value: >-
                -Xms250m
                -Xmx450m
          readinessProbe:
            httpGet:
              path: /actuator/health
              port: 8080
          livenessProbe:
            httpGet:
              path: /actuator/info
              port: 8080
          volumeMounts:
            - name: db-credentials
              mountPath: "/etc/movies-db"
              readOnly: true
            - name: tmp
              mountPath: "/tmp"
              readOnly: false
      volumes:
        - name: db-credentials
          secret:
            secretName: moviesuser.movies-db-cluster.credentials
        - name: tmp
          emptyDir: {}
status: {}
---
apiVersion: v1
kind: Service
metadata:
  creationTimestamp: null
  labels:
    app: movies-spring-web
  name: movies-spring-web
spec:
  ports:
    - name: 8080-8080
      port: 8080
      protocol: TCP
      targetPort: 8080
  selector:
    app: movies-spring-web
  type: ClusterIP
status:
  loadBalancer: {}
We will remove the jdk.management.agent module as well from our jlink.sh :
#!/bin/sh -

set -o errexit

BASE_DIR="$(
  cd "$(dirname "$0")"
  pwd -P
)"

DEPS_DIR="$BASE_DIR/deps"

mkdir -p "$DEPS_DIR"

echo "extracting jar"
cd "$DEPS_DIR"
jar -xf ../*.jar
echo "jar extracted"

echo "generate JVM modules list"
EX_JVM_DEPS="jdk.crypto.ec"
JVM_DEPS=$(jdeps -s --multi-release 11 -recursive -cp BOOT-INF/lib/*.jar BOOT-INF/classes | \
  grep -Po '(java|jdk)\..*' | \
  sort -u | \
  tr '\n' ',')
MODULES="$JVM_DEPS$EX_JVM_DEPS"
echo "$MODULES"
echo "JVM modules list generated"

echo "doing jlink"
jlink \
    --verbose \
    --module-path "$JAVA_HOME/jmods", \
    --add-modules "$MODULES" \
    --compress 2 \
    --no-header-files \
    --no-man-pages \
    --strip-debug \
    --output "$DEPS_DIR/jre-jlink"

echo "jlink done"

cd "$BASE_DIR"
Then we build & deploy our service :
$ ./build.sh
$ ./deploy.sh
And now we follow the procedure, including scaling and restart to perform a clean test :
| Step | C. Users | Pods | ART | TPS | Max CPU | Max MEM |
|---|---|---|---|---|---|---|
| 01 base | 10 | 1 | 570.47 | 16.73 | 916 | 487 |
| 02 Java 11 | 10 | 1 | 517.01 | 18.47 | 875 | 918 |
| 03 jlink | 10 | 1 | 518.97 | 18.41 | 875 | 787 |
| 04 heap | 10 | 1 | 451.73 | 21.13 | 816 | 633 |
heap changes
Changing the garbage collector
All the test that we have done so far are using the G1 garbage collector, this is the default since Java 9, however we could change the one that we use changing in our deployment the environment variables to tell the JVM which one to use.
For enabling the parallel garbage collector we will edit our deployment.yml :
apiVersion: apps/v1
kind: Deployment
metadata:
  creationTimestamp: null
  labels:
    app: movies-spring-web
  name: movies-spring-web
spec:
  replicas: 1
  selector:
    matchLabels:
      app: movies-spring-web
  strategy: {}
  template:
    metadata:
      creationTimestamp: null
      labels:
        app: movies-spring-web
    spec:
      containers:
        - image: localhost:32000/movies-spring-web:0.0.1
          imagePullPolicy: Always
          name: movies-spring-web
          resources: {}
          env:
            - name: "JAVA_OPTS"
              value: >-
                -XX:+UseParallelGC
                -Xms250m
                -Xmx450m
          readinessProbe:
            httpGet:
              path: /actuator/health
              port: 8080
          livenessProbe:
            httpGet:
              path: /actuator/info
              port: 8080
          volumeMounts:
            - name: db-credentials
              mountPath: "/etc/movies-db"
              readOnly: true
            - name: tmp
              mountPath: "/tmp"
              readOnly: false
      volumes:
        - name: db-credentials
          secret:
            secretName: moviesuser.movies-db-cluster.credentials
        - name: tmp
          emptyDir: {}
status: {}
---
apiVersion: v1
kind: Service
metadata:
  creationTimestamp: null
  labels:
    app: movies-spring-web
  name: movies-spring-web
spec:
  ports:
    - name: 8080-8080
      port: 8080
      protocol: TCP
      targetPort: 8080
  selector:
    app: movies-spring-web
  type: ClusterIP
status:
  loadBalancer: {}
If we run our load test again this is the number that we get :
| Step | C. Users | Pods | ART | TPS | Max CPU | Max MEM |
|---|---|---|---|---|---|---|
| 01 base | 10 | 1 | 570.47 | 16.73 | 916 | 487 |
| 02 Java 11 | 10 | 1 | 517.01 | 18.47 | 875 | 918 |
| 03 jlink | 10 | 1 | 518.97 | 18.41 | 875 | 787 |
| 04 heap | 10 | 1 | 451.73 | 21.13 | 816 | 633 |
| 05 parallel GC | 10 | 1 | 450.85 | 21.17 | 799 | 626 |
parallel gc
We could see that parallel is even better than G1 as overall, but may need to understand this.
G1 is really good to have a predictable pauses when doing garbage collection, and he is continuously working on do part of the work without producing pauses. parallel in other hand is just waiting to certain thresholds to actually start doing the cleaning and them pause unpredictable, however the overall performance is better. Finally G1 is really for bigger heaps and that’s is not the case in in our service.
This number will vary a lot depending or what your service does, for example if you have tons of static data G1 may be better fit.
Connection pool
So far we haven take into account how our service is connected to the database, to check it out let’s connect to our database and find it out.
First we will forward the master of our database to a local port with :
$ microk8s.kubectl port-forward movies-db-cluster-0 6432:5432
Forwarding from 127.0.0.1:6432 -> 5432
Forwarding from [::1]:6432 -> 5432
Now we will get the password from our moviesdba user :
$ microk8s.kubectl get secret moviesdba.movies-db-cluster.credentials -o 'jsonpath={.data.password}' | base64 -d
k1lYa8DJ6SeXSBY8lsvacEP1BmCRAYTrAk6HuGC9wP8aK1va7Q5voX1Ih6VrWNUA
Finally we will use PSQL to connect to our database :
$  psql -h localhost -p 6432 -U moviesdba movies
Password for user moviesdba:
psql (11.6 (Ubuntu 11.6-1.pgdg18.04+1))
SSL connection (protocol: TLSv1.3, cipher: TLS_AES_256_GCM_SHA384, bits: 256, compression: off)
Type "help" for help.

movies=#
For knowing how many active connection for our moviesuser we have we could do :
movies=# select count(*) from pg_stat_activity where pg_stat_activity.usename='moviesuser';
 count
-------
     0
(1 row)
If we run our load test and when is running we execute the same command we will see something like :
movies=# select count(*) from pg_stat_activity where pg_stat_activity.usename='moviesuser';
 count
-------
    10
(1 row)
First we will modify our application.yml to define our pool :
movies-datasource:
  driver: "org.postgresql.Driver"
  connection-string: "jdbc:postgresql://\
    ${MOVIES_DB_CLUSTER_SERVICE_HOST}:${MOVIES_DB_CLUSTER_SERVICE_PORT_POSTGRESQL}\
    /movies"
  credentials: "/etc/movies-db"
  read-only : true
  pool :
    min-connections : 1
    max-connections : 3
Now we will modify our DataSourceProperties class :
package org.learning.by.example.movies.spring.web.datasource;

import org.springframework.boot.context.properties.ConfigurationProperties;
import org.springframework.stereotype.Component;

@Component
@ConfigurationProperties("movies-datasource")
public class DataSourceProperties {
    public String getDriver() {
        return driver;
    }

    public void setDriver(String driver) {
        this.driver = driver;
    }

    public String getConnectionString() {
        return connectionString;
    }

    public void setConnectionString(String connectionString) {
        this.connectionString = connectionString;
    }

    public String getCredentials() {
        return credentials;
    }

    public void setCredentials(String credentials) {
        this.credentials = credentials;
    }

    public Boolean getReadOnly() {
        return readOnly;
    }

    public void setReadOnly(Boolean readOnly) {
        this.readOnly = readOnly;
    }

    public PoolConfig getPool() {
        return pool;
    }

    public void setPool(PoolConfig pool) {
        this.pool = pool;
    }

    private String driver;
    private String connectionString;
    private String credentials;
    private Boolean readOnly;
    private PoolConfig pool;

    public static class PoolConfig {
        public int getMinConnections() {
            return minConnections;
        }

        public void setMinConnections(int minConnections) {
            this.minConnections = minConnections;
        }

        public int getMaxConnections() {
            return maxConnections;
        }

        public void setMaxConnections(int maxConnections) {
            this.maxConnections = maxConnections;
        }

        private int minConnections;
        private int maxConnections;
    }

}
And finally our MoviesDataSource class
package org.learning.by.example.movies.spring.web.datasource;

import com.zaxxer.hikari.HikariDataSource;
import org.apache.commons.logging.Log;
import org.apache.commons.logging.LogFactory;
import org.springframework.stereotype.Component;

import java.nio.file.Files;
import java.nio.file.Path;
import java.nio.file.Paths;

@Component
public class MoviesDataSource extends HikariDataSource {
    private static final Log log = LogFactory.getLog(MoviesDataSource.class);

    MoviesDataSource(final DataSourceProperties dataSourceProperties) {
        super();
        this.setDriverClassName(dataSourceProperties.getDriver());
        this.setJdbcUrl(dataSourceProperties.getConnectionString());
        final String credentials = dataSourceProperties.getCredentials();
        this.setUsername(getCredentialValue(credentials, "username"));
        this.setPassword(getCredentialValue(credentials, "password"));
        this.setReadOnly(dataSourceProperties.getReadOnly());
        this.setMinimumIdle(dataSourceProperties.getPool().getMinConnections());
        this.setMaximumPoolSize(dataSourceProperties.getPool().getMaxConnections());
        this.setConnectionTestQuery("SELECT 1");
    }

    private String getCredentialValue(final String credentials, final String value) {
        final Path path = Paths.get(credentials, value);
        try {
            return new String(Files.readAllBytes(path));
        } catch (Exception ex) {
            throw new RuntimeException("error getting data source credential value : " + path.toString(), ex);
        }
    }
}
No we could build and deploy our service again to repeat our test :
| Step | C. Users | Pods | ART | TPS | Max CPU | Max MEM |
|---|---|---|---|---|---|---|
| 01 base | 10 | 1 | 570.47 | 16.73 | 916 | 487 |
| 02 Java 11 | 10 | 1 | 517.01 | 18.47 | 875 | 918 |
| 03 jlink | 10 | 1 | 518.97 | 18.41 | 875 | 787 |
| 04 heap | 10 | 1 | 451.73 | 21.13 | 816 | 633 |
| 05 parallel GC | 10 | 1 | 450.85 | 21.17 | 799 | 626 |
| 06 connection pool | 10 | 1 | 129.0 | 85.49 | 625 | 363 |
connection pool
We have improve our service further since we now reuse our connections.
Final Touches
Now we will finalize our optimizing we will change some more settings, first we will modify our POM to disable Logback and enable log4j2 that have better performance.
<dependency>
    <groupId>org.springframework.boot</groupId>
    <artifactId>spring-boot-starter</artifactId>
    <exclusions>
        <exclusion>
            <groupId>org.springframework.boot</groupId>
            <artifactId>spring-boot-starter-logging</artifactId>
        </exclusion>
    </exclusions>
</dependency>
<dependency>
    <groupId>org.springframework.boot</groupId>
    <artifactId>spring-boot-starter-log4j2</artifactId>
</dependency>
We will set log to error disable the spring banner an disable JMX adding to our application.yaml :
logging:
  level:
    ROOT: ERROR
spring:
  main:
    banner-mode: off
  jmx:
    enabled: false
Now let’s run a new run with our final changes :
| Step | C. Users | Pods | ART | TPS | Max CPU | Max MEM |
|---|---|---|---|---|---|---|
| 01 base | 10 | 1 | 570.47 | 16.73 | 916 | 487 |
| 02 Java 11 | 10 | 1 | 517.01 | 18.47 | 875 | 918 |
| 03 jlink | 10 | 1 | 518.97 | 18.41 | 875 | 787 |
| 04 heap | 10 | 1 | 451.73 | 21.13 | 816 | 633 |
| 05 parallel GC | 10 | 1 | 450.85 | 21.17 | 799 | 626 |
| 06 connection pool | 10 | 1 | 129.0 | 85.49 | 625 | 363 |
| 07 final | 10 | 1 | 111.61 | 85.53 | 626 | 350 |
final
Running the complete set
With this we are ready to run our final test running the full set, let’s do it so :
| C. Users | Pods | ART | TPS | Max CPU | Max MEM | Service |
|---|---|---|---|---|---|---|
| 1 | 1 | 39.16 | 25.49 | 403 | 474 | 01 Base |
| 1 | 1 | 34.61 | 28.85 | 209 | 252 | 02 Spring Web |
| 10 | 1 | 570.47 | 16.73 | 916 | 487 | 01 Base |
| 10 | 1 | 111.61 | 85.53 | 626 | 350 | 02 Spring Web |
| 25 | 3 | 1615.82 | 14.72 | 1049 | 1454 | 01 Base |
| 25 | 1 | 266.03 | 89.44 | 686 | 369 | 02 Spring Web |
| 50 | 5 | 3190.98 | 14.89 | 1351 | 2499 | 01 Base |
| 50 | 3 | 1982.03 | 23.95 | 774 | 1060 | 02 Spring Web |
01 Base = Java 8 - Spring Boot 2.2.2 - Spring Web - Spring Data JDBC default settings, unoptimized
02 Spring Web = Java 11 - Spring Boot 2.2.2 - Spring Web - Spring Data JDBC optimized
Conclusions
With this optimization we have drastically improve our service, it use less CPU and Memory and we need to have less pods running for been able to support the same amount of concurrent users with an improve response time.
In the next chapters of this series we will start to use other frameworks to measure them against our results.
Note: The full code of this service is available at this repository.
Resources
- https://spring.io/guides/topicals/spring-boot-docker
- https://docs.gigaspaces.com/xap/14.0/rn/java11-guidelines.html
- https://kubernetes.io/docs/tasks/inject-data-application/define-environment-variable-container/
- https://spring.io/blog/2015/12/10/spring-boot-memory-performance
- https://stackoverflow.com/a/30070428
- https://www.optaplanner.org/blog/2015/07/31/WhatIsTheFastestGarbageCollectorInJava8.html
- https://spring.io/blog/2018/12/12/how-fast-is-spring